

12 Response Surface Methodology
403
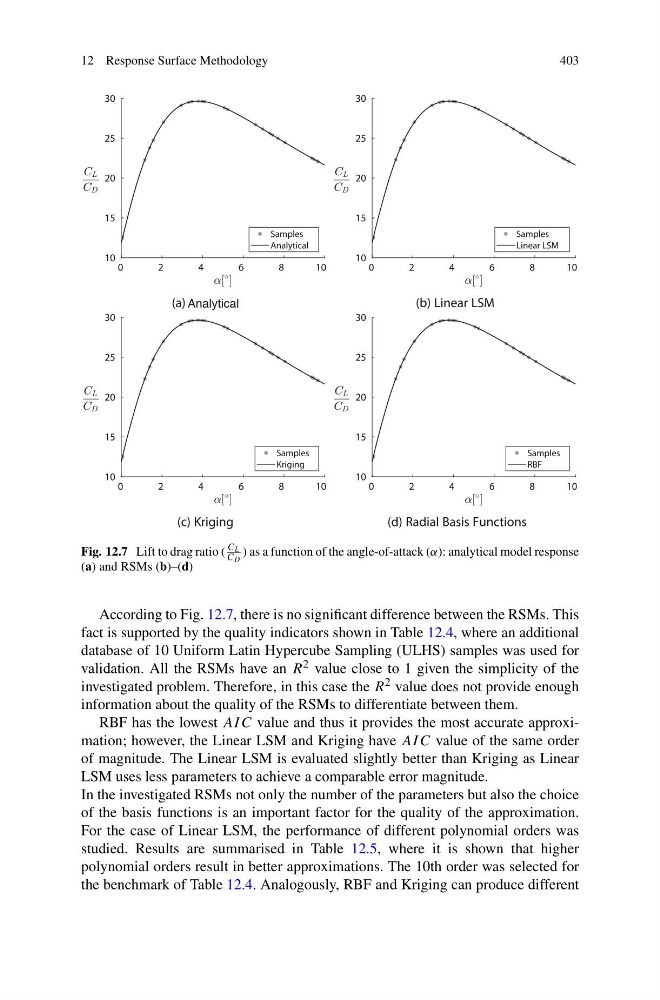
Fig. 12.7 Lift to drag ratio (
C L
C D
) as a function of the angle-of-attack (α): analytical model response
(a) and RSMs (b)–(d)
According to Fig. 12.7, there is no significant difference between the RSMs. This
fact is supported by the quality indicators shown in Table 12.4, where an additional
database of 10 Uniform Latin Hypercube Sampling (ULHS) samples was used for
validation. All the RSMs have an R 2 value close to 1 given the simplicity of the
investigated problem. Therefore, in this case the R 2 value does not provide enough
information about the quality of the RSMs to differentiate between them.
RBF has the lowest AI C value and thus it provides the most accurate approximation; however, the Linear LSM and Kriging have AI C value of the same order
of magnitude. The Linear LSM is evaluated slightly better than Kriging as Linear
LSM uses less parameters to achieve a comparable error magnitude.
In the investigated RSMs not only the number of the parameters but also the choice
of the basis functions is an important factor for the quality of the approximation.
For the case of Linear LSM, the performance of different polynomial orders was
studied. Results are summarised in Table 12.5, where it is shown that higher
polynomial orders result in better approximations. The 10th order was selected for
the benchmark of Table 12.4. Analogously, RBF and Kriging can produce different
403
Fig. 12.7 Lift to drag ratio (
C L
C D
) as a function of the angle-of-attack (α): analytical model response
(a) and RSMs (b)–(d)
According to Fig. 12.7, there is no significant difference between the RSMs. This
fact is supported by the quality indicators shown in Table 12.4, where an additional
database of 10 Uniform Latin Hypercube Sampling (ULHS) samples was used for
validation. All the RSMs have an R 2 value close to 1 given the simplicity of the
investigated problem. Therefore, in this case the R 2 value does not provide enough
information about the quality of the RSMs to differentiate between them.
RBF has the lowest AI C value and thus it provides the most accurate approximation; however, the Linear LSM and Kriging have AI C value of the same order
of magnitude. The Linear LSM is evaluated slightly better than Kriging as Linear
LSM uses less parameters to achieve a comparable error magnitude.
In the investigated RSMs not only the number of the parameters but also the choice
of the basis functions is an important factor for the quality of the approximation.
For the case of Linear LSM, the performance of different polynomial orders was
studied. Results are summarised in Table 12.5, where it is shown that higher
polynomial orders result in better approximations. The 10th order was selected for
the benchmark of Table 12.4. Analogously, RBF and Kriging can produce different