

402
P. Z. Korondi et al.
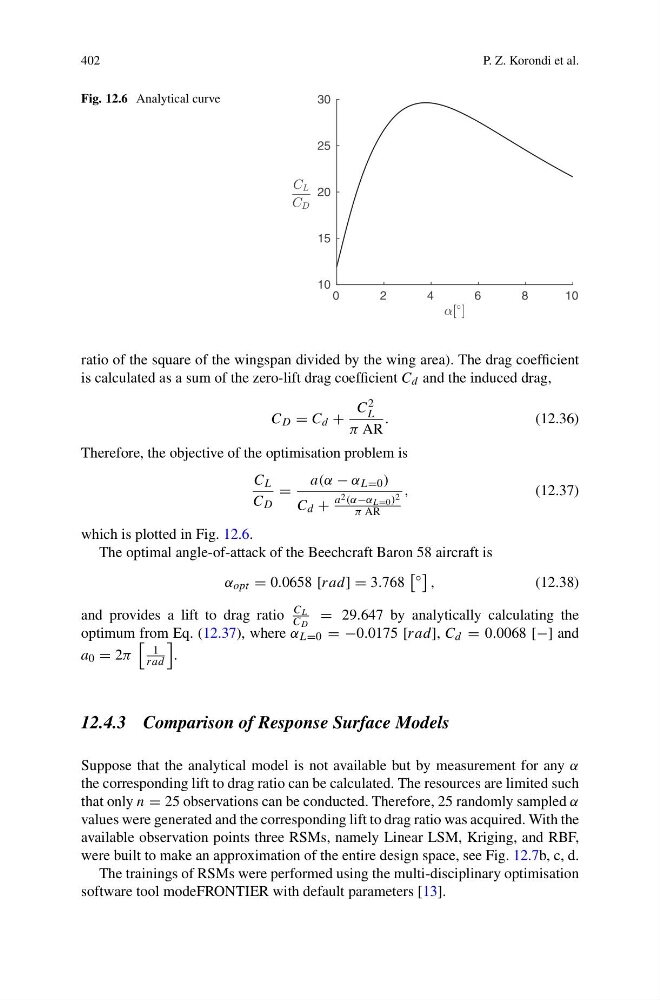
Fig. 12.6 Analytical curve
0
2
4
6
8
1 0
10
15
20
25
30
ratio of the square of the wingspan divided by the wing area). The drag coefficient
is calculated as a sum of the zero-lift drag coefficient C d and the induced drag,
C D = C d +
C 2
L
π AR
.
(12.36)
Therefore, the objective of the optimisation problem is
C L
C D
=
a(α − α L=0 )
C d +
a 2 (α−α L=0 ) 2
π AR
,
(12.37)
which is plotted in Fig. 12.6.
The optimal angle-of-attack of the Beechcraft Baron 58 aircraft is
α opt = 0.0658 [rad] = 3.768
◦
,
(12.38)
and provides a lift to drag ratio
C L
C D
= 29.647 by analytically calculating the
optimum from Eq. (12.37), where α L=0 = −0.0175 [rad], C d = 0.0068 [−] and
a 0 = 2π
1
rad
.
12.4.3 Comparison of Response Surface Models
Suppose that the analytical model is not available but by measurement for any α
the corresponding lift to drag ratio can be calculated. The resources are limited such
that only n = 25 observations can be conducted. Therefore, 25 randomly sampled α
values were generated and the corresponding lift to drag ratio was acquired. With the
available observation points three RSMs, namely Linear LSM, Kriging, and RBF,
were built to make an approximation of the entire design space, see Fig. 12.7b, c, d.
The trainings of RSMs were performed using the multi-disciplinary optimisation
software tool modeFRONTIER with default parameters [13].
P. Z. Korondi et al.
Fig. 12.6 Analytical curve
0
2
4
6
8
1 0
10
15
20
25
30
ratio of the square of the wingspan divided by the wing area). The drag coefficient
is calculated as a sum of the zero-lift drag coefficient C d and the induced drag,
C D = C d +
C 2
L
π AR
.
(12.36)
Therefore, the objective of the optimisation problem is
C L
C D
=
a(α − α L=0 )
C d +
a 2 (α−α L=0 ) 2
π AR
,
(12.37)
which is plotted in Fig. 12.6.
The optimal angle-of-attack of the Beechcraft Baron 58 aircraft is
α opt = 0.0658 [rad] = 3.768
◦
,
(12.38)
and provides a lift to drag ratio
C L
C D
= 29.647 by analytically calculating the
optimum from Eq. (12.37), where α L=0 = −0.0175 [rad], C d = 0.0068 [−] and
a 0 = 2π
1
rad
.
12.4.3 Comparison of Response Surface Models
Suppose that the analytical model is not available but by measurement for any α
the corresponding lift to drag ratio can be calculated. The resources are limited such
that only n = 25 observations can be conducted. Therefore, 25 randomly sampled α
values were generated and the corresponding lift to drag ratio was acquired. With the
available observation points three RSMs, namely Linear LSM, Kriging, and RBF,
were built to make an approximation of the entire design space, see Fig. 12.7b, c, d.
The trainings of RSMs were performed using the multi-disciplinary optimisation
software tool modeFRONTIER with default parameters [13].