

8 An Introduction to Many-Objective Evolutionary Optimization
291
visualizations, often presented on paper or screen, appears on a 2D media, which
also means it is limited to only show anything in 2D. What we normally do in
single or multi-objective optimization is to present the objective space on a Cartesian
coordinate system. With this method, we can easily view 1D and 2D spaces, and, by
using projection methods, 3D space can also be viewed on a 2D plane. The problem
is, physically, we cannot construct or observe higher dimensions [45].
In many-objective optimization, the number of objectives is higher than 3. This
implies that using the scatterplot method would limit us to only view 3D or lower
dimension spaces.
8.4.3.1 Bubble Chart
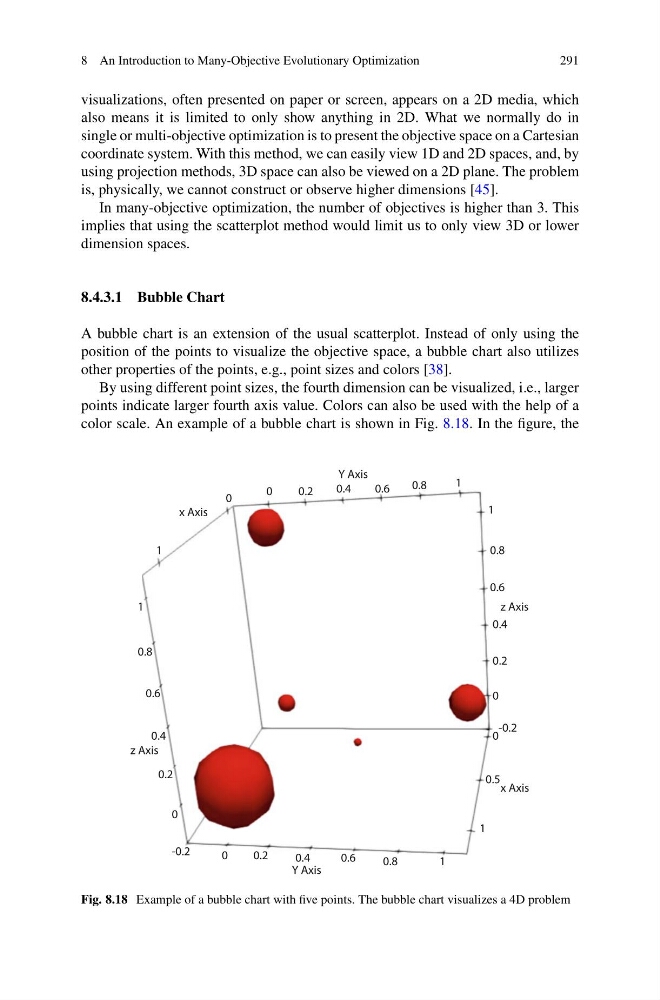
A bubble chart is an extension of the usual scatterplot. Instead of only using the
position of the points to visualize the objective space, a bubble chart also utilizes
other properties of the points, e.g., point sizes and colors [38].
By using different point sizes, the fourth dimension can be visualized, i.e., larger
points indicate larger fourth axis value. Colors can also be used with the help of a
color scale. An example of a bubble chart is shown in Fig. 8.18. In the figure, the
0
0.2
0.4
0.6
0.8
1
1
0.8
0.6
0.4
z Axis
0.2
0
-0.2
0
0.5
1
0.8
0.6
0.4
0.2
0
-0.2
0
0.2
0.4
0.6
0.8
1
1
x Axis
x Axis
z Axis
Y Axis
Y Axis
0
1
Fig. 8.18 Example of a bubble chart with five points. The bubble chart visualizes a 4D problem
291
visualizations, often presented on paper or screen, appears on a 2D media, which
also means it is limited to only show anything in 2D. What we normally do in
single or multi-objective optimization is to present the objective space on a Cartesian
coordinate system. With this method, we can easily view 1D and 2D spaces, and, by
using projection methods, 3D space can also be viewed on a 2D plane. The problem
is, physically, we cannot construct or observe higher dimensions [45].
In many-objective optimization, the number of objectives is higher than 3. This
implies that using the scatterplot method would limit us to only view 3D or lower
dimension spaces.
8.4.3.1 Bubble Chart
A bubble chart is an extension of the usual scatterplot. Instead of only using the
position of the points to visualize the objective space, a bubble chart also utilizes
other properties of the points, e.g., point sizes and colors [38].
By using different point sizes, the fourth dimension can be visualized, i.e., larger
points indicate larger fourth axis value. Colors can also be used with the help of a
color scale. An example of a bubble chart is shown in Fig. 8.18. In the figure, the
0
0.2
0.4
0.6
0.8
1
1
0.8
0.6
0.4
z Axis
0.2
0
-0.2
0
0.5
1
0.8
0.6
0.4
0.2
0
-0.2
0
0.2
0.4
0.6
0.8
1
1
x Axis
x Axis
z Axis
Y Axis
Y Axis
0
1
Fig. 8.18 Example of a bubble chart with five points. The bubble chart visualizes a 4D problem