

658
Y. Mizuno et al.
0
5000
10000
15000
20000
25000
30000
35000
40000
12/31
0:00
1/31
0:00
2/28
0:00
3/31
0:00
4/30
0:00
5/31
0:00
6/30
0:00
7/31
0:00
8/31
0:00
9/30
0:00
10/31
0:00
11/30
0:00
12/31
0:00
Nm3-H2
Hydrogen In the Tank (Case C)
HydTankSoC
SoCLowLimit
SoCUpLimit
0
5000
10000
15000
20000
25000
30000
35000
40000
12/31
0:00
1/31
0:00
2/28
0:00
3/31
0:00
4/30
0:00
5/31
0:00
6/30
0:00
7/31
0:00
8/31
0:00
9/30
0:00
10/31
0:00
11/30
0:00
12/31
0:00
Nm3-H2
Hydrogen in the tank (Case D)
HydTankSoC
SoCLowLimit
SoCUpLimit
(a)
(b)
Thresholds are lowered 0.8%
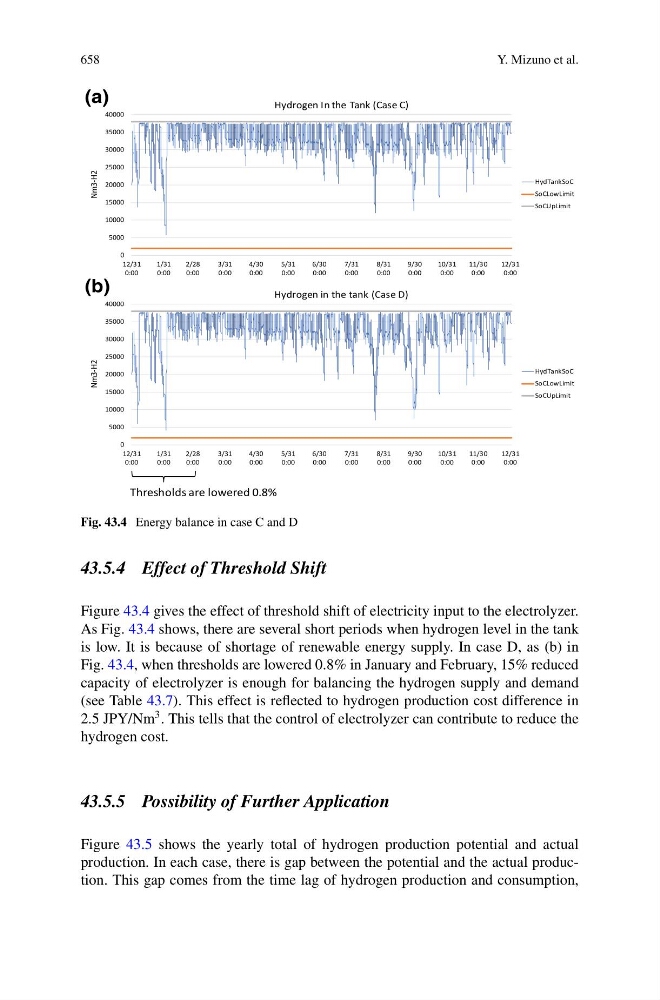
Fig. 43.4 Energy balance in case C and D
43.5.4 Effect of Threshold Shift
Figure 43.4 gives the effect of threshold shift of electricity input to the electrolyzer.
As Fig. 43.4 shows, there are several short periods when hydrogen level in the tank
is low. It is because of shortage of renewable energy supply. In case D, as (b) in
Fig. 43.4, when thresholds are lowered 0.8% in January and February, 15% reduced
capacity of electrolyzer is enough for balancing the hydrogen supply and demand
(see Table 43.7). This effect is reflected to hydrogen production cost difference in
2.5 JPY/Nm
3 . This tells that the control of electrolyzer can contribute to reduce the
hydrogen cost.
43.5.5 Possibility of Further Application
Figure 43.5 shows the yearly total of hydrogen production potential and actual
production. In each case, there is gap between the potential and the actual production. This gap comes from the time lag of hydrogen production and consumption,