

656
Y. Mizuno et al.
Table 43.7 The capacities of the cases
Case A
Case B
Case C
Case D
Thresholds
0–1.2% 40–100% 12.8–16.0% 12.8–15.5%, 12.0–14.7%
Capacity of electrolyzer
(MW)
3.8
188.1
10.1
8.5
Capacity of hydrogen tank
(Nm 3 )
25,000
150,000
40,000
40,000
Capacity factor of
electrolyzer
65%
1%
25%
31%
43.5.2 Economic Feasibility
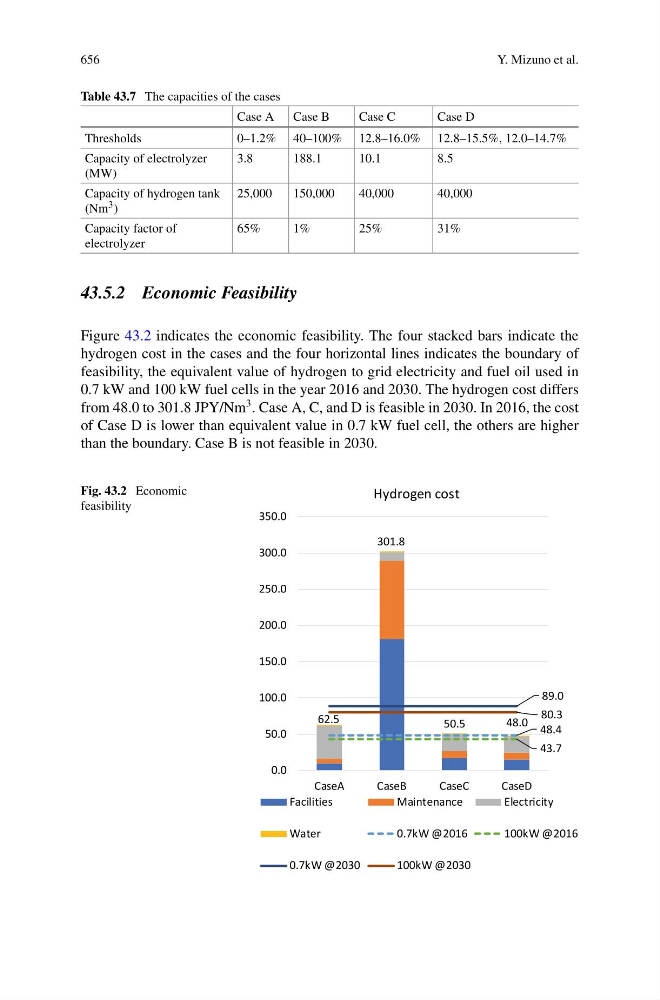
Figure 43.2 indicates the economic feasibility. The four stacked bars indicate the
hydrogen cost in the cases and the four horizontal lines indicates the boundary of
feasibility, the equivalent value of hydrogen to grid electricity and fuel oil used in
0.7 kW and 100 kW fuel cells in the year 2016 and 2030. The hydrogen cost differs
from 48.0 to 301.8 JPY/Nm
3 . Case A, C, and D is feasible in 2030. In 2016, the cost
of Case D is lower than equivalent value in 0.7 kW fuel cell, the others are higher
than the boundary. Case B is not feasible in 2030.
Fig. 43.2 Economic
feasibility
62.5
301.8
50.5
48.0 48.4
43.7
89.0
80.3
0.0
50.0
100.0
150.0
200.0
250.0
300.0
350.0
CaseA
CaseB
CaseC
CaseD
Hydrogen cost
Facilities
Maintenance
Electricity
Water
0.7kW @2016
100kW @2016
0.7kW @2030
100kW @2030