

43 A Feasibility Study of a Japanese Power …
655
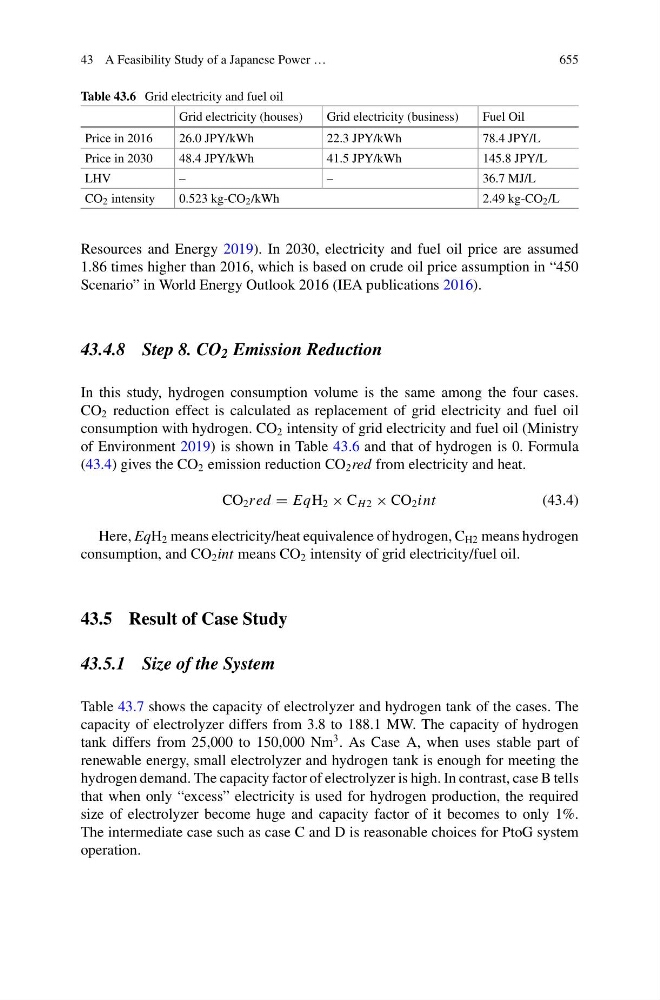
Table 43.6 Grid electricity and fuel oil
Grid electricity (houses)
Grid electricity (business)
Fuel Oil
Price in 2016
26.0 JPY/kWh
22.3 JPY/kWh
78.4 JPY/L
Price in 2030
48.4 JPY/kWh
41.5 JPY/kWh
145.8 JPY/L
LHV
–
–
36.7 MJ/L
CO 2 intensity
0.523 kg-CO 2 /kWh
2.49 kg-CO 2 /L
Resources and Energy 2019). In 2030, electricity and fuel oil price are assumed
1.86 times higher than 2016, which is based on crude oil price assumption in “450
Scenario” in World Energy Outlook 2016 (IEA publications 2016).
43.4.8 Step 8. CO 2 Emission Reduction
In this study, hydrogen consumption volume is the same among the four cases.
CO 2 reduction effect is calculated as replacement of grid electricity and fuel oil
consumption with hydrogen. CO 2 intensity of grid electricity and fuel oil (Ministry
of Environment 2019) is shown in Table 43.6 and that of hydrogen is 0. Formula
(43.4) gives the CO 2 emission reduction CO 2 red from electricity and heat.
CO 2 red = EqH 2 × C H 2 × CO 2 int
(43.4)
Here, EqH 2 means electricity/heat equivalence of hydrogen, C H2 means hydrogen
consumption, and CO 2 int means CO 2 intensity of grid electricity/fuel oil.
43.5 Result of Case Study
43.5.1 Size of the System
Table 43.7 shows the capacity of electrolyzer and hydrogen tank of the cases. The
capacity of electrolyzer differs from 3.8 to 188.1 MW. The capacity of hydrogen
tank differs from 25,000 to 150,000 Nm
3 . As Case A, when uses stable part of
renewable energy, small electrolyzer and hydrogen tank is enough for meeting the
hydrogen demand. The capacity factor of electrolyzer is high. In contrast, case B tells
that when only “excess” electricity is used for hydrogen production, the required
size of electrolyzer become huge and capacity factor of it becomes to only 1%.
The intermediate case such as case C and D is reasonable choices for PtoG system
operation.