

652
Y. Mizuno et al.
Table 43.2 The outline of
renewable energy
PV
Wind
Synthetic
Capacity (kW)
168,000 147,000 315,000
Max output (kWh/h)
168,000 147,000 313,400
Median of output (kWh/h) 1067
27,979
40,000
Capacity factor
15%
28%
21%
As a result, Table 43.2 shows the outline of renewable power generation.
43.4.4 Step 4. Hydrogen Production Pattern
In step 4 and 5, hydrogen production pattern and hydrogen storage capacity are
assumed in trial and error manner.
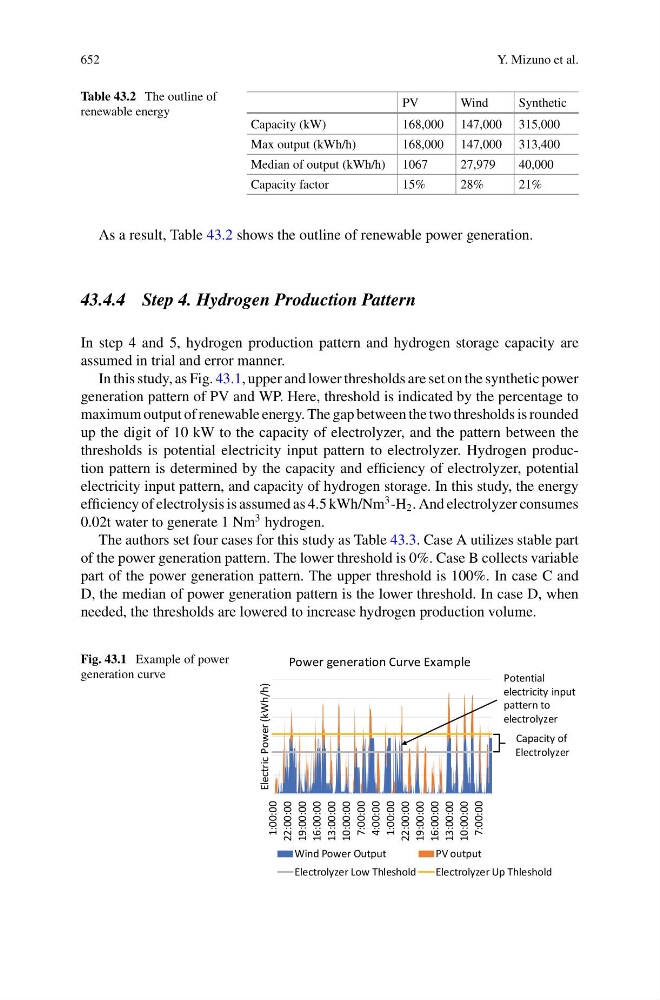
In this study, as Fig. 43.1, upper and lower thresholds are set on the synthetic power
generation pattern of PV and WP. Here, threshold is indicated by the percentage to
maximum output of renewable energy. The gap between the two thresholds is rounded
up the digit of 10 kW to the capacity of electrolyzer, and the pattern between the
thresholds is potential electricity input pattern to electrolyzer. Hydrogen production pattern is determined by the capacity and efficiency of electrolyzer, potential
electricity input pattern, and capacity of hydrogen storage. In this study, the energy
efficiency of electrolysis is assumed as 4.5 kWh/Nm
3 -H 2 . And electrolyzer consumes
0.02t water to generate 1 Nm
3 hydrogen.
The authors set four cases for this study as Table 43.3. Case A utilizes stable part
of the power generation pattern. The lower threshold is 0%. Case B collects variable
part of the power generation pattern. The upper threshold is 100%. In case C and
D, the median of power generation pattern is the lower threshold. In case D, when
needed, the thresholds are lowered to increase hydrogen production volume.
Fig. 43.1 Example of power
generation curve
1:00:00
22:00:00
19:00:00
16:00:00
13:00:00
10:00:00
7:00:00
4:00:00
1:00:00
22:00:00
19:00:00
16:00:00
13:00:00
10:00:00
7:00:00
Electric Power (kWh/h)
Power generation Curve Example
Wind Power Output
PV output
Electrolyzer Low Thleshold
Electrolyzer Up Thleshold
Capacity of
Electrolyzer
Potential
electricity input
pattern to
electrolyzer