

43 A Feasibility Study of a Japanese Power …
651
43.4.2 Step 2. Fuel Cell and Hydrogen Demand
Considering electricity demand of public facilities and houses, the fuel cells to be
installed is selected from currently available products. As a result, one 100kWe size
PEM (Proton Exchange Membrane) fuel cell is installed to each public facility and
one 0.7kWe size PEM fuel cell is installed to each house.
Output of FCs are determined based on electricity demands of facilities, the FC
electricity output in every hour is maximum output that does not excess the electricity
demand of the facility. The heat output and hydrogen consumption are subordinately
calculated from the electricity output. The yearly total of hydrogen demand in 0.7 kW
fuel cells is 2,659,366 Nm
3 and that of 100 kW fuel cells is 2,374,100 Nm
3 .
43.4.3 Step 3. Power Generation Pattern
Photovoltaics and wind power locate in Rokkasho Village are utilized for power
source of hydrogen in this study. Specific power generation patterns of renewables
are normally unavailable. So here, the authors suppose the power generation patterns
from public data. Solar radiation intensity and wind speed data are got from NEDO
METPV-11 database (NEDO 2019). The capacity of PV panels and wind turbines
are the sum of existing power stations in 2016 (Agency for Natural Resources and
Energy 2019).
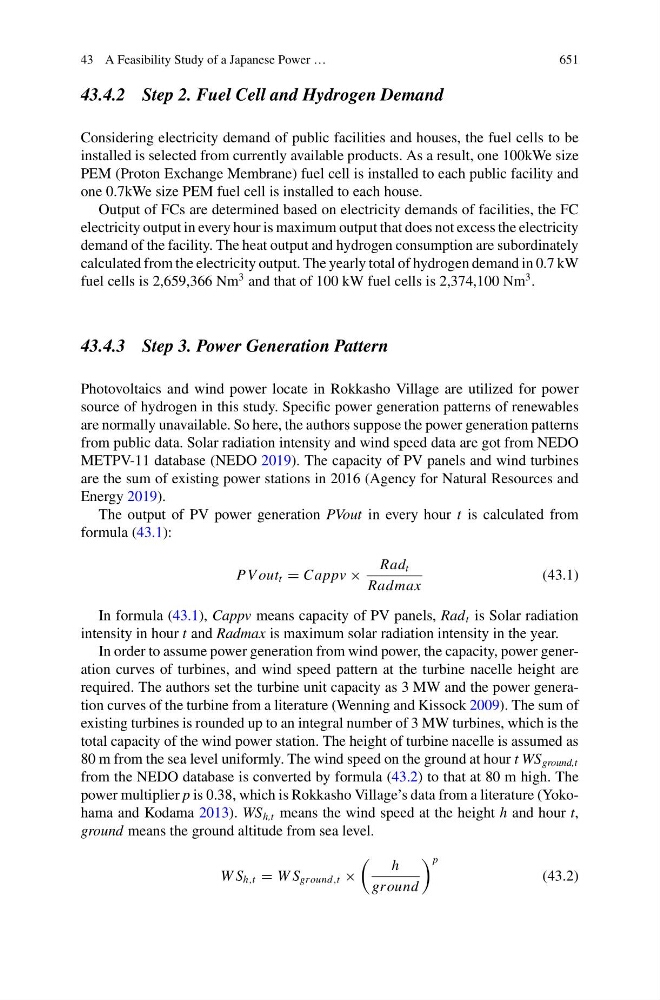
The output of PV power generation PVout in every hour t is calculated from
formula (43.1):
PV out t = Cappv ×
Rad t
Radmax
(43.1)
In formula (43.1), Cappv means capacity of PV panels, Rad t is Solar radiation
intensity in hour t and Radmax is maximum solar radiation intensity in the year.
In order to assume power generation from wind power, the capacity, power generation curves of turbines, and wind speed pattern at the turbine nacelle height are
required. The authors set the turbine unit capacity as 3 MW and the power generation curves of the turbine from a literature (Wenning and Kissock 2009). The sum of
existing turbines is rounded up to an integral number of 3 MW turbines, which is the
total capacity of the wind power station. The height of turbine nacelle is assumed as
80 m from the sea level uniformly. The wind speed on the ground at hour t WS ground,t
from the NEDO database is converted by formula (43.2) to that at 80 m high. The
power multiplier p is 0.38, which is Rokkasho Village’s data from a literature (Yokohama and Kodama 2013). WS h,t means the wind speed at the height h and hour t,
ground means the ground altitude from sea level.
W S h,t = W S ground,t ×
h
ground
p
(43.2)