

43 A Feasibility Study of a Japanese Power …
653
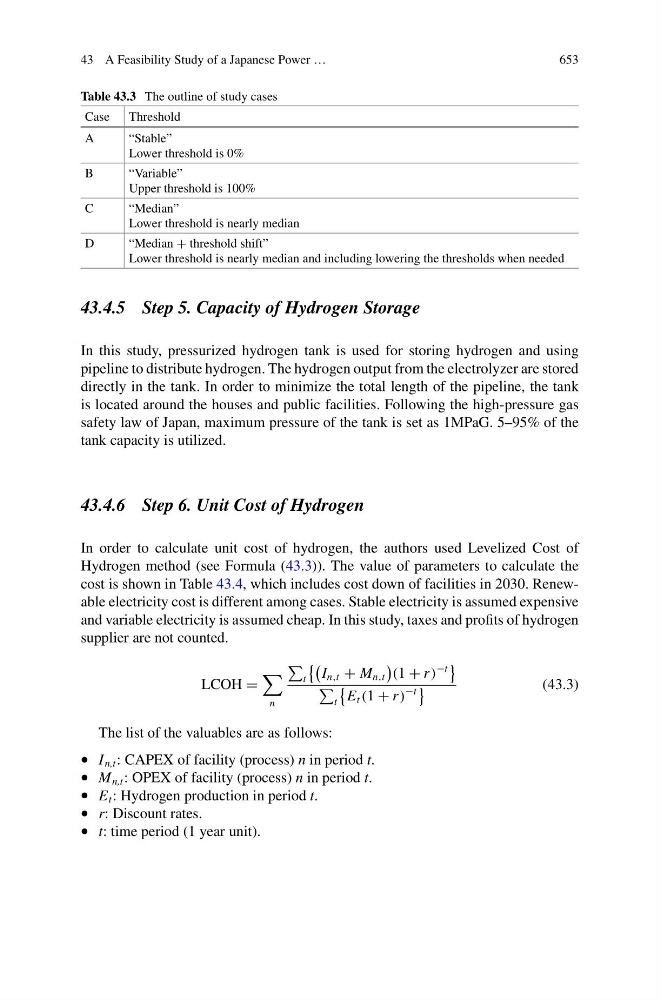
Table 43.3 The outline of study cases
Case
Threshold
A
“Stable”
Lower threshold is 0%
B
“Variable”
Upper threshold is 100%
C
“Median”
Lower threshold is nearly median
D
“Median + threshold shift”
Lower threshold is nearly median and including lowering the thresholds when needed
43.4.5 Step 5. Capacity of Hydrogen Storage
In this study, pressurized hydrogen tank is used for storing hydrogen and using
pipeline to distribute hydrogen. The hydrogen output from the electrolyzer are stored
directly in the tank. In order to minimize the total length of the pipeline, the tank
is located around the houses and public facilities. Following the high-pressure gas
safety law of Japan, maximum pressure of the tank is set as 1MPaG. 5–95% of the
tank capacity is utilized.
43.4.6 Step 6. Unit Cost of Hydrogen
In order to calculate unit cost of hydrogen, the authors used Levelized Cost of
Hydrogen method (see Formula (43.3)). The value of parameters to calculate the
cost is shown in Table 43.4, which includes cost down of facilities in 2030. Renewable electricity cost is different among cases. Stable electricity is assumed expensive
and variable electricity is assumed cheap. In this study, taxes and profits of hydrogen
supplier are not counted.
LCOH =
n
t
I n,t + M n,t
(1 + r )
−t
t
E t (1 + r )
−t
(43.3)
The list of the valuables are as follows:
• I n,t : CAPEX of facility (process) n in period t.
• M n,t : OPEX of facility (process) n in period t.
• E t : Hydrogen production in period t.
• r: Discount rates.
• t: time period (1 year unit).