

628
M. Chen et al.
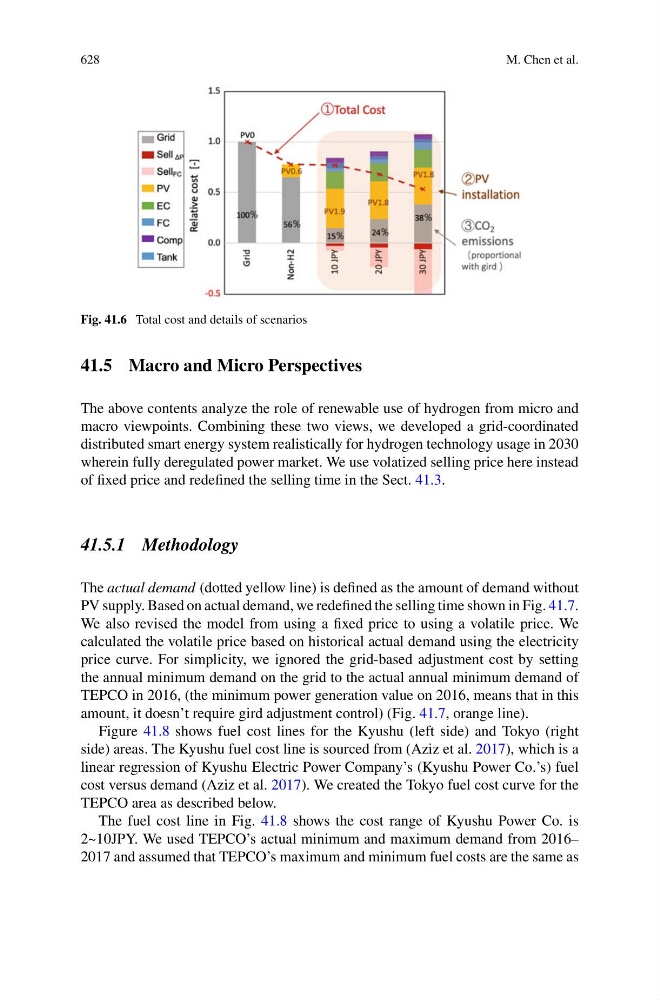
Fig. 41.6 Total cost and details of scenarios
41.5 Macro and Micro Perspectives
The above contents analyze the role of renewable use of hydrogen from micro and
macro viewpoints. Combining these two views, we developed a grid-coordinated
distributed smart energy system realistically for hydrogen technology usage in 2030
wherein fully deregulated power market. We use volatized selling price here instead
of fixed price and redefined the selling time in the Sect. 41.3.
41.5.1 Methodology
The actual demand (dotted yellow line) is defined as the amount of demand without
PV supply. Based on actual demand, we redefined the selling time shown in Fig. 41.7.
We also revised the model from using a fixed price to using a volatile price. We
calculated the volatile price based on historical actual demand using the electricity
price curve. For simplicity, we ignored the grid-based adjustment cost by setting
the annual minimum demand on the grid to the actual annual minimum demand of
TEPCO in 2016, (the minimum power generation value on 2016, means that in this
amount, it doesn’t require gird adjustment control) (Fig. 41.7, orange line).
Figure 41.8 shows fuel cost lines for the Kyushu (left side) and Tokyo (right
side) areas. The Kyushu fuel cost line is sourced from (Aziz et al. 2017), which is a
linear regression of Kyushu Electric Power Company’s (Kyushu Power Co.’s) fuel
cost versus demand (Aziz et al. 2017). We created the Tokyo fuel cost curve for the
TEPCO area as described below.
The fuel cost line in Fig. 41.8 shows the cost range of Kyushu Power Co. is
2~10JPY. We used TEPCO’s actual minimum and maximum demand from 2016–
2017 and assumed that TEPCO’s maximum and minimum fuel costs are the same as