

41 Techno-economic Analysis on Renewable Energy via Hydrogen …
629
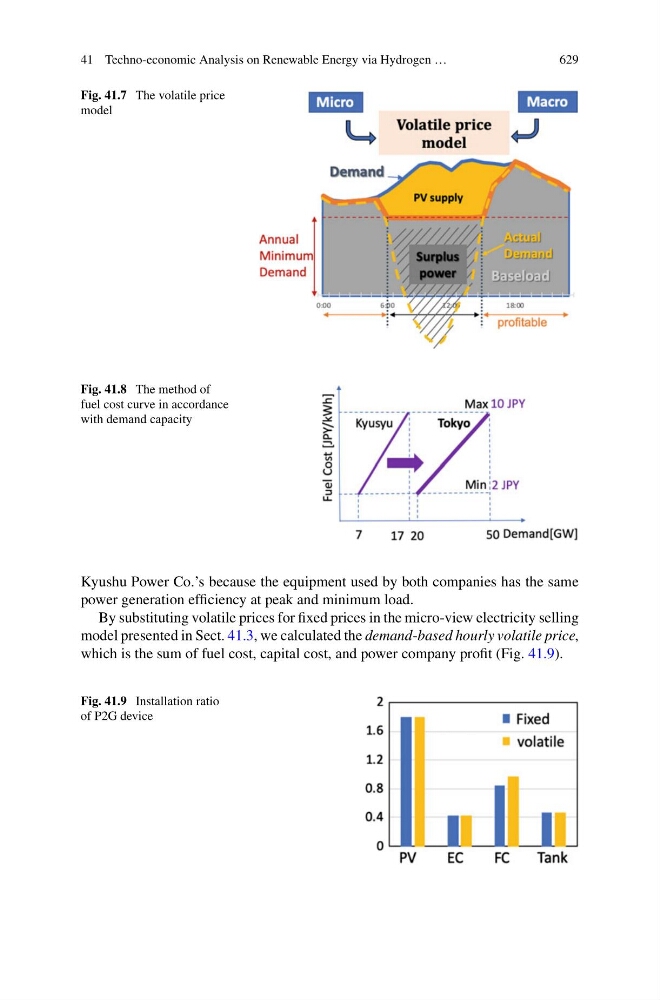
Fig. 41.7 The volatile price
model
Fig. 41.8 The method of
fuel cost curve in accordance
with demand capacity
Kyushu Power Co.’s because the equipment used by both companies has the same
power generation efficiency at peak and minimum load.
By substituting volatile prices for fixed prices in the micro-view electricity selling
model presented in Sect. 41.3, we calculated the demand-based hourly volatile price,
which is the sum of fuel cost, capital cost, and power company profit (Fig. 41.9).
Fig. 41.9 Installation ratio
of P2G device