

624
M. Chen et al.
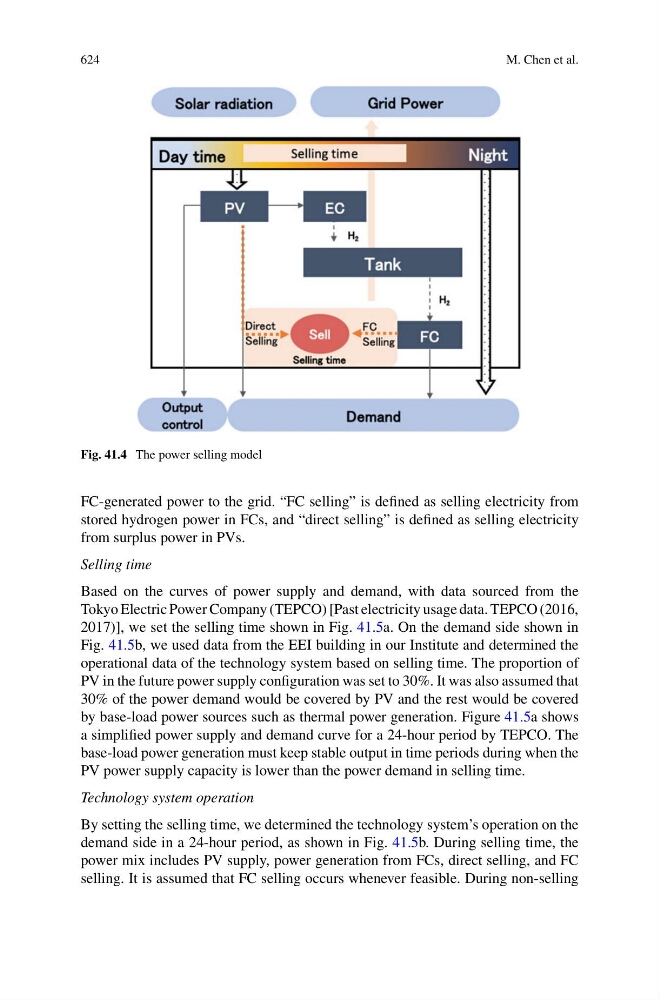
Fig. 41.4 The power selling model
FC-generated power to the grid. “FC selling” is defined as selling electricity from
stored hydrogen power in FCs, and “direct selling” is defined as selling electricity
from surplus power in PVs.
Selling time
Based on the curves of power supply and demand, with data sourced from the
Tokyo Electric Power Company (TEPCO) [Past electricity usage data. TEPCO (2016,
2017)], we set the selling time shown in Fig. 41.5a. On the demand side shown in
Fig. 41.5b, we used data from the EEI building in our Institute and determined the
operational data of the technology system based on selling time. The proportion of
PV in the future power supply configuration was set to 30%. It was also assumed that
30% of the power demand would be covered by PV and the rest would be covered
by base-load power sources such as thermal power generation. Figure 41.5a shows
a simplified power supply and demand curve for a 24-hour period by TEPCO. The
base-load power generation must keep stable output in time periods during when the
PV power supply capacity is lower than the power demand in selling time.
Technology system operation
By setting the selling time, we determined the technology system’s operation on the
demand side in a 24-hour period, as shown in Fig. 41.5b. During selling time, the
power mix includes PV supply, power generation from FCs, direct selling, and FC
selling. It is assumed that FC selling occurs whenever feasible. During non-selling