

41 Techno-economic Analysis on Renewable Energy via Hydrogen …
625
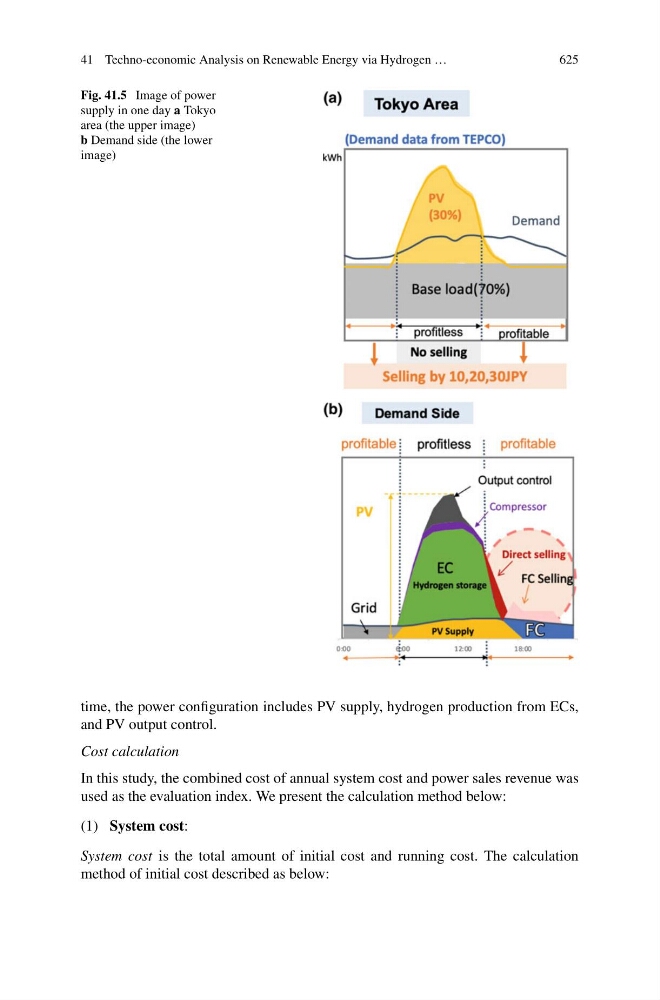
Fig. 41.5 Image of power
supply in one day a Tokyo
area (the upper image)
b Demand side (the lower
image)
time, the power configuration includes PV supply, hydrogen production from ECs,
and PV output control.
Cost calculation
In this study, the combined cost of annual system cost and power sales revenue was
used as the evaluation index. We present the calculation method below:
(1) System cost:
System cost is the total amount of initial cost and running cost. The calculation
method of initial cost described as below: