

31 Development of a Method for Measuring Resource Efficiency …
477
0
1
2
3
Resource Efficiency
0 A B C D
Good
Bad
A Disposal
B Sturdy design
C Remanufacturing
D Maintenance
0 Standard
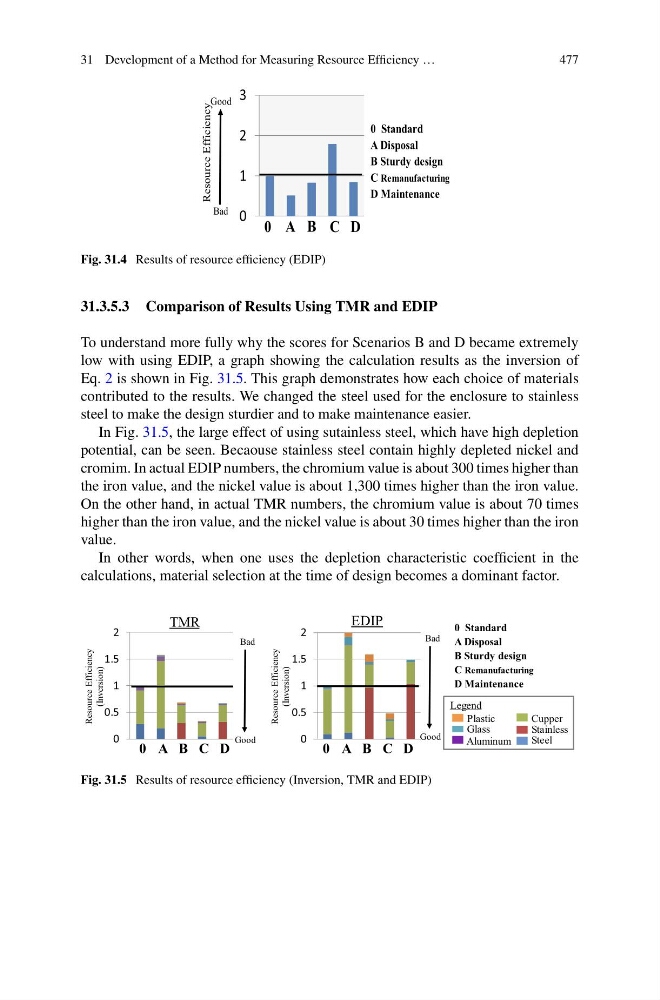
Fig. 31.4 Results of resource efficiency (EDIP)
31.3.5.3 Comparison of Results Using TMR and EDIP
To understand more fully why the scores for Scenarios B and D became extremely
low with using EDIP, a graph showing the calculation results as the inversion of
Eq. 2 is shown in Fig. 31.5. This graph demonstrates how each choice of materials
contributed to the results. We changed the steel used for the enclosure to stainless
steel to make the design sturdier and to make maintenance easier.
In Fig. 31.5, the large effect of using sutainless steel, which have high depletion
potential, can be seen. Becaouse stainless steel contain highly depleted nickel and
cromim. In actual EDIP numbers, the chromium value is about 300 times higher than
the iron value, and the nickel value is about 1,300 times higher than the iron value.
On the other hand, in actual TMR numbers, the chromium value is about 70 times
higher than the iron value, and the nickel value is about 30 times higher than the iron
value.
In other words, when one uses the depletion characteristic coefficient in the
calculations, material selection at the time of design becomes a dominant factor.
TMR
EDIP
Resource Efficiency
(Inversion)
Resource Efficiency
(Inversion)
0 A B C D
0 A B C D
Legend
Plastic
Glass
Aluminum
Cupper
Stainless
Steel
0
0.5
1
1.5
2
0
0.5
1
1.5
2
Good
Bad
Good
Bad
A Disposal
B Sturdy design
C Remanufacturing
D Maintenance
0 Standard
Fig. 31.5 Results of resource efficiency (Inversion, TMR and EDIP)
477
0
1
2
3
Resource Efficiency
0 A B C D
Good
Bad
A Disposal
B Sturdy design
C Remanufacturing
D Maintenance
0 Standard
Fig. 31.4 Results of resource efficiency (EDIP)
31.3.5.3 Comparison of Results Using TMR and EDIP
To understand more fully why the scores for Scenarios B and D became extremely
low with using EDIP, a graph showing the calculation results as the inversion of
Eq. 2 is shown in Fig. 31.5. This graph demonstrates how each choice of materials
contributed to the results. We changed the steel used for the enclosure to stainless
steel to make the design sturdier and to make maintenance easier.
In Fig. 31.5, the large effect of using sutainless steel, which have high depletion
potential, can be seen. Becaouse stainless steel contain highly depleted nickel and
cromim. In actual EDIP numbers, the chromium value is about 300 times higher than
the iron value, and the nickel value is about 1,300 times higher than the iron value.
On the other hand, in actual TMR numbers, the chromium value is about 70 times
higher than the iron value, and the nickel value is about 30 times higher than the iron
value.
In other words, when one uses the depletion characteristic coefficient in the
calculations, material selection at the time of design becomes a dominant factor.
TMR
EDIP
Resource Efficiency
(Inversion)
Resource Efficiency
(Inversion)
0 A B C D
0 A B C D
Legend
Plastic
Glass
Aluminum
Cupper
Stainless
Steel
0
0.5
1
1.5
2
0
0.5
1
1.5
2
Good
Bad
Good
Bad
A Disposal
B Sturdy design
C Remanufacturing
D Maintenance
0 Standard
Fig. 31.5 Results of resource efficiency (Inversion, TMR and EDIP)