

476
G. Miyake et al.
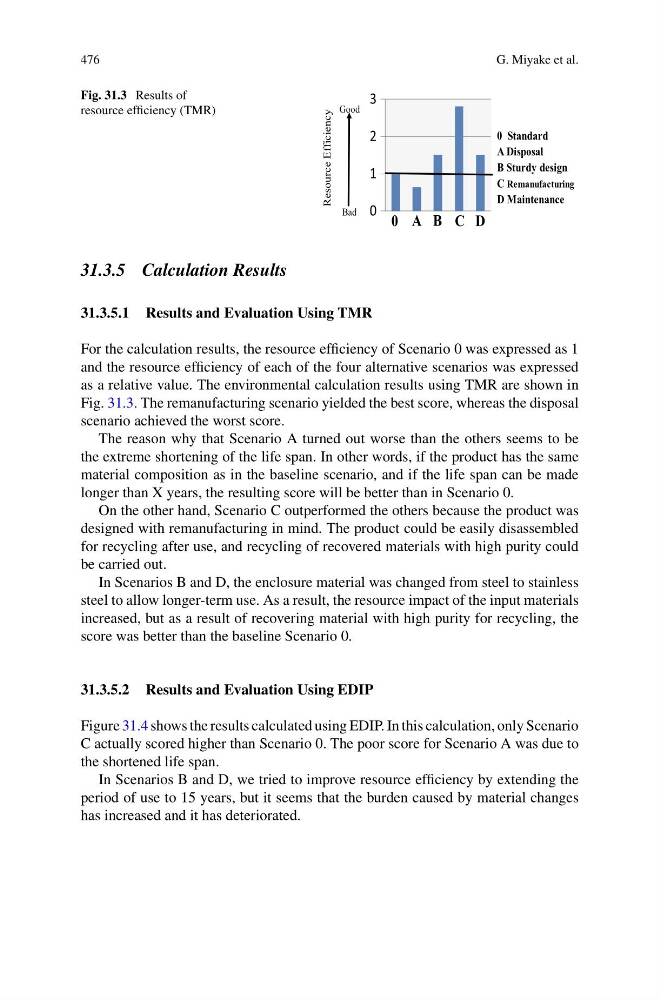
Fig. 31.3 Results of
resource efficiency (TMR)
0
1
2
3
Good
Bad
Resource Efficiency
0 A B C D
A Disposal
B Sturdy design
C Remanufacturing
D Maintenance
0 Standard
31.3.5 Calculation Results
31.3.5.1 Results and Evaluation Using TMR
For the calculation results, the resource efficiency of Scenario 0 was expressed as 1
and the resource efficiency of each of the four alternative scenarios was expressed
as a relative value. The environmental calculation results using TMR are shown in
Fig. 31.3. The remanufacturing scenario yielded the best score, whereas the disposal
scenario achieved the worst score.
The reason why that Scenario A turned out worse than the others seems to be
the extreme shortening of the life span. In other words, if the product has the same
material composition as in the baseline scenario, and if the life span can be made
longer than X years, the resulting score will be better than in Scenario 0.
On the other hand, Scenario C outperformed the others because the product was
designed with remanufacturing in mind. The product could be easily disassembled
for recycling after use, and recycling of recovered materials with high purity could
be carried out.
In Scenarios B and D, the enclosure material was changed from steel to stainless
steel to allow longer-term use. As a result, the resource impact of the input materials
increased, but as a result of recovering material with high purity for recycling, the
score was better than the baseline Scenario 0.
31.3.5.2 Results and Evaluation Using EDIP
Figure 31.4 shows the results calculated using EDIP. In this calculation, only Scenario
C actually scored higher than Scenario 0. The poor score for Scenario A was due to
the shortened life span.
In Scenarios B and D, we tried to improve resource efficiency by extending the
period of use to 15 years, but it seems that the burden caused by material changes
has increased and it has deteriorated.
G. Miyake et al.
Fig. 31.3 Results of
resource efficiency (TMR)
0
1
2
3
Good
Bad
Resource Efficiency
0 A B C D
A Disposal
B Sturdy design
C Remanufacturing
D Maintenance
0 Standard
31.3.5 Calculation Results
31.3.5.1 Results and Evaluation Using TMR
For the calculation results, the resource efficiency of Scenario 0 was expressed as 1
and the resource efficiency of each of the four alternative scenarios was expressed
as a relative value. The environmental calculation results using TMR are shown in
Fig. 31.3. The remanufacturing scenario yielded the best score, whereas the disposal
scenario achieved the worst score.
The reason why that Scenario A turned out worse than the others seems to be
the extreme shortening of the life span. In other words, if the product has the same
material composition as in the baseline scenario, and if the life span can be made
longer than X years, the resulting score will be better than in Scenario 0.
On the other hand, Scenario C outperformed the others because the product was
designed with remanufacturing in mind. The product could be easily disassembled
for recycling after use, and recycling of recovered materials with high purity could
be carried out.
In Scenarios B and D, the enclosure material was changed from steel to stainless
steel to allow longer-term use. As a result, the resource impact of the input materials
increased, but as a result of recovering material with high purity for recycling, the
score was better than the baseline Scenario 0.
31.3.5.2 Results and Evaluation Using EDIP
Figure 31.4 shows the results calculated using EDIP. In this calculation, only Scenario
C actually scored higher than Scenario 0. The poor score for Scenario A was due to
the shortened life span.
In Scenarios B and D, we tried to improve resource efficiency by extending the
period of use to 15 years, but it seems that the burden caused by material changes
has increased and it has deteriorated.