

27 Scenario Analysis of Environmental Impact of Paddy Rice …
421
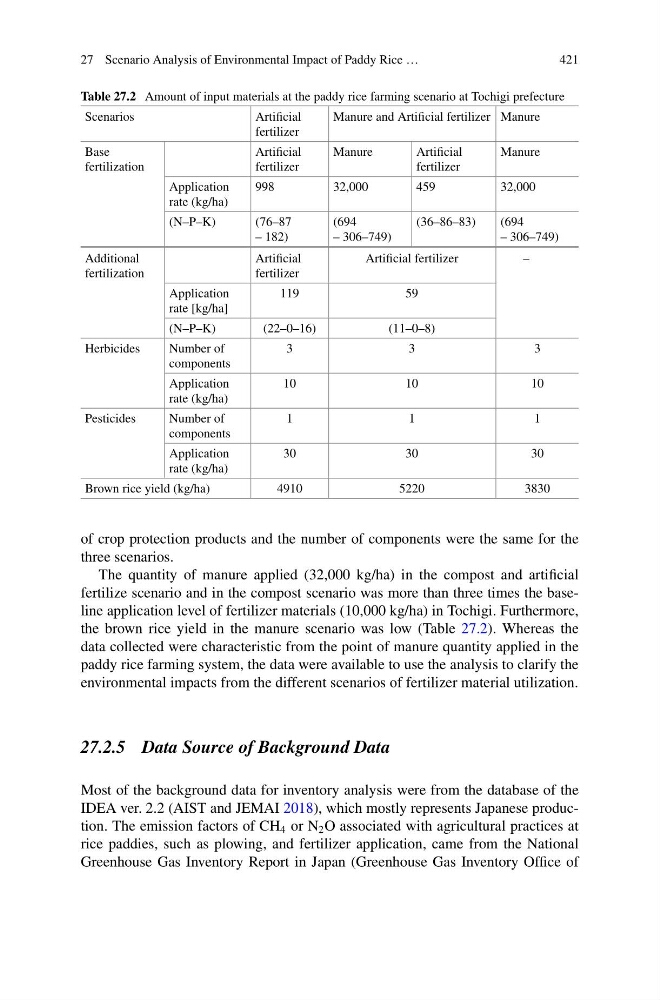
Table 27.2 Amount of input materials at the paddy rice farming scenario at Tochigi prefecture
Scenarios
Artificial
fertilizer
Manure and Artificial fertilizer Manure
Base
fertilization
Artificial
fertilizer
Manure
Artificial
fertilizer
Manure
Application
rate (kg/ha)
998
32,000
459
32,000
(N–P–K)
(76–87
– 182)
(694
– 306–749)
(36–86–83)
(694
– 306–749)
Additional
fertilization
Artificial
fertilizer
Artificial fertilizer
–
Application
rate [kg/ha]
119
59
(N–P–K)
(22–0–16)
(11–0–8)
Herbicides
Number of
components
3
3
3
Application
rate (kg/ha)
10
10
10
Pesticides
Number of
components
1
1
1
Application
rate (kg/ha)
30
30
30
Brown rice yield (kg/ha)
4910
5220
3830
of crop protection products and the number of components were the same for the
three scenarios.
The quantity of manure applied (32,000 kg/ha) in the compost and artificial
fertilize scenario and in the compost scenario was more than three times the baseline application level of fertilizer materials (10,000 kg/ha) in Tochigi. Furthermore,
the brown rice yield in the manure scenario was low (Table 27.2). Whereas the
data collected were characteristic from the point of manure quantity applied in the
paddy rice farming system, the data were available to use the analysis to clarify the
environmental impacts from the different scenarios of fertilizer material utilization.
27.2.5 Data Source of Background Data
Most of the background data for inventory analysis were from the database of the
IDEA ver. 2.2 (AIST and JEMAI 2018), which mostly represents Japanese production. The emission factors of CH 4 or N 2 O associated with agricultural practices at
rice paddies, such as plowing, and fertilizer application, came from the National
Greenhouse Gas Inventory Report in Japan (Greenhouse Gas Inventory Office of
421
Table 27.2 Amount of input materials at the paddy rice farming scenario at Tochigi prefecture
Scenarios
Artificial
fertilizer
Manure and Artificial fertilizer Manure
Base
fertilization
Artificial
fertilizer
Manure
Artificial
fertilizer
Manure
Application
rate (kg/ha)
998
32,000
459
32,000
(N–P–K)
(76–87
– 182)
(694
– 306–749)
(36–86–83)
(694
– 306–749)
Additional
fertilization
Artificial
fertilizer
Artificial fertilizer
–
Application
rate [kg/ha]
119
59
(N–P–K)
(22–0–16)
(11–0–8)
Herbicides
Number of
components
3
3
3
Application
rate (kg/ha)
10
10
10
Pesticides
Number of
components
1
1
1
Application
rate (kg/ha)
30
30
30
Brown rice yield (kg/ha)
4910
5220
3830
of crop protection products and the number of components were the same for the
three scenarios.
The quantity of manure applied (32,000 kg/ha) in the compost and artificial
fertilize scenario and in the compost scenario was more than three times the baseline application level of fertilizer materials (10,000 kg/ha) in Tochigi. Furthermore,
the brown rice yield in the manure scenario was low (Table 27.2). Whereas the
data collected were characteristic from the point of manure quantity applied in the
paddy rice farming system, the data were available to use the analysis to clarify the
environmental impacts from the different scenarios of fertilizer material utilization.
27.2.5 Data Source of Background Data
Most of the background data for inventory analysis were from the database of the
IDEA ver. 2.2 (AIST and JEMAI 2018), which mostly represents Japanese production. The emission factors of CH 4 or N 2 O associated with agricultural practices at
rice paddies, such as plowing, and fertilizer application, came from the National
Greenhouse Gas Inventory Report in Japan (Greenhouse Gas Inventory Office of