

404
J. Druschke et al.
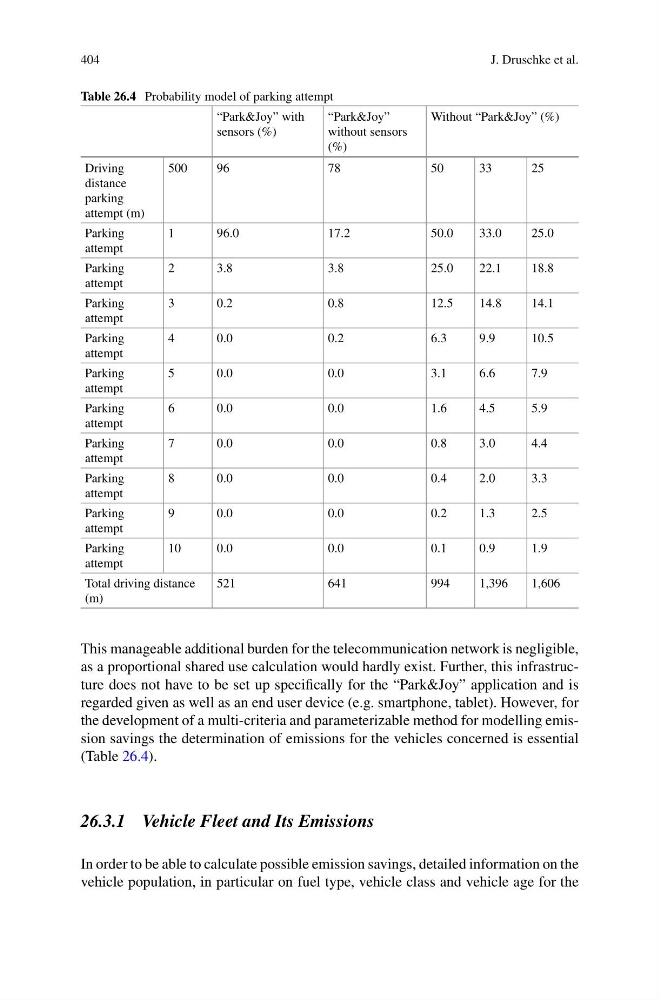
Table 26.4 Probability model of parking attempt
“Park&Joy” with
sensors (%)
“Park&Joy”
without sensors
(%)
Without “Park&Joy” (%)
Driving
distance
parking
attempt (m)
500
96
78
50
33
25
Parking
attempt
1
96.0
17.2
50.0
33.0
25.0
Parking
attempt
2
3.8
3.8
25.0
22.1
18.8
Parking
attempt
3
0.2
0.8
12.5
14.8
14.1
Parking
attempt
4
0.0
0.2
6.3
9.9
10.5
Parking
attempt
5
0.0
0.0
3.1
6.6
7.9
Parking
attempt
6
0.0
0.0
1.6
4.5
5.9
Parking
attempt
7
0.0
0.0
0.8
3.0
4.4
Parking
attempt
8
0.0
0.0
0.4
2.0
3.3
Parking
attempt
9
0.0
0.0
0.2
1.3
2.5
Parking
attempt
10
0.0
0.0
0.1
0.9
1.9
Total driving distance
(m)
521
641
994
1,396
1,606
This manageable additional burden for the telecommunication network is negligible,
as a proportional shared use calculation would hardly exist. Further, this infrastructure does not have to be set up specifically for the “Park&Joy” application and is
regarded given as well as an end user device (e.g. smartphone, tablet). However, for
the development of a multi-criteria and parameterizable method for modelling emission savings the determination of emissions for the vehicles concerned is essential
(Table 26.4).
26.3.1 Vehicle Fleet and Its Emissions
In order to be able to calculate possible emission savings, detailed information on the
vehicle population, in particular on fuel type, vehicle class and vehicle age for the
J. Druschke et al.
Table 26.4 Probability model of parking attempt
“Park&Joy” with
sensors (%)
“Park&Joy”
without sensors
(%)
Without “Park&Joy” (%)
Driving
distance
parking
attempt (m)
500
96
78
50
33
25
Parking
attempt
1
96.0
17.2
50.0
33.0
25.0
Parking
attempt
2
3.8
3.8
25.0
22.1
18.8
Parking
attempt
3
0.2
0.8
12.5
14.8
14.1
Parking
attempt
4
0.0
0.2
6.3
9.9
10.5
Parking
attempt
5
0.0
0.0
3.1
6.6
7.9
Parking
attempt
6
0.0
0.0
1.6
4.5
5.9
Parking
attempt
7
0.0
0.0
0.8
3.0
4.4
Parking
attempt
8
0.0
0.0
0.4
2.0
3.3
Parking
attempt
9
0.0
0.0
0.2
1.3
2.5
Parking
attempt
10
0.0
0.0
0.1
0.9
1.9
Total driving distance
(m)
521
641
994
1,396
1,606
This manageable additional burden for the telecommunication network is negligible,
as a proportional shared use calculation would hardly exist. Further, this infrastructure does not have to be set up specifically for the “Park&Joy” application and is
regarded given as well as an end user device (e.g. smartphone, tablet). However, for
the development of a multi-criteria and parameterizable method for modelling emission savings the determination of emissions for the vehicles concerned is essential
(Table 26.4).
26.3.1 Vehicle Fleet and Its Emissions
In order to be able to calculate possible emission savings, detailed information on the
vehicle population, in particular on fuel type, vehicle class and vehicle age for the