

23 Process Modelling for an Efficient and Dynamic Energy …
367
rently) and pump seem working well to maintain desired temperature in the facility
(Temperature F&P active), for optimal plant growth. It can also be noted from average
number of pump and cooling (fan) ONs (active) that both cooling systems (fans and
pumps) are synchronised well to maintain desired temperatures. Since the system is
set-up to run fans first and pump if required, it is noted that average number of times
that fans run are greater than that of pumps active throughout the cycle of operation.
This can be an indication of efficient running of cooling system for a protected crop
farcicality that is subject to a significant range of temperatures during the plant cycle
of 8 months. Since the facility is well maintained at desired temperatures during the
whole cycle of more than 8 months, these plants were in a much better conduction
considering the outdoor temperature.
We showed that the system is working as expected, by activing the cooling at
the right times (Fig. 23.1). Similarly, heating of the facility is considered from the
perspective of measured temperature at the facility with temperatures of heating
systems. Since there are two heating systems (Wall and Floor) using hot water, water
temperature at entry and exit of both systems (wall and Floor) are considered.
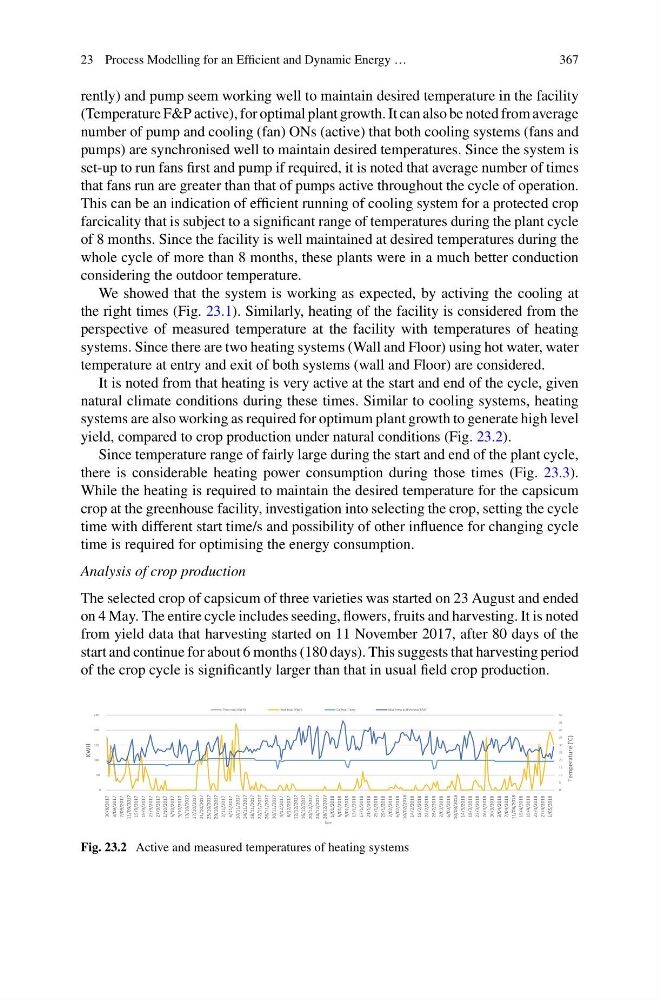
It is noted from that heating is very active at the start and end of the cycle, given
natural climate conditions during these times. Similar to cooling systems, heating
systems are also working as required for optimum plant growth to generate high level
yield, compared to crop production under natural conditions (Fig. 23.2).
Since temperature range of fairly large during the start and end of the plant cycle,
there is considerable heating power consumption during those times (Fig. 23.3).
While the heating is required to maintain the desired temperature for the capsicum
crop at the greenhouse facility, investigation into selecting the crop, setting the cycle
time with different start time/s and possibility of other influence for changing cycle
time is required for optimising the energy consumption.
Analysis of crop production
The selected crop of capsicum of three varieties was started on 23 August and ended
on 4 May. The entire cycle includes seeding, flowers, fruits and harvesting. It is noted
from yield data that harvesting started on 11 November 2017, after 80 days of the
start and continue for about 6 months (180 days). This suggests that harvesting period
of the crop cycle is significantly larger than that in usual field crop production.
0
5
10
15
20
25
30
35
40
45
50
0
50
100
150
200
250
30/8/2017
3/09/2017
7/09/2017
11/09/2017
15/9/2017
19/9/2017
23/9/2017
27/9/2017
1/10/2017
5/10/2017
9/10/2017
13/10/2017
17/10/2017
21/10/2017
25/10/2017
29/10/2017
2/11/2017
6/11/2017
10/11/2017
14/11/2017
18/11/2017
22/11/2017
26/11/2017
30/11/2017
4/12/2017
8/12/2017
12/12/2017
16/12/2017
20/12/2017
24/12/2017
28/12/2017
1/01/2018
5/01/2018
9/01/2018
13/1/2018
17/1/2018
21/1/2018
25/1/2018
29/1/2018
2/02/2018
6/02/2018
10/02/2018
14/2/2018
18/2/2018
22/2/2018
26/2/2018
2/03/2018
6/03/2018
10/03/2018
14/3/2018
18/3/2018
22/3/2018
26/3/2018
30/3/2018
3/04/2018
7/04/2018
11/04/2018
15/4/2018
19/4/2018
23/4/2018
27/4/2018
1/05/2018
Temperature (°C)
KWH
Date
Floor total (KWH)
Wall total (KWH)
Cal Heat Temp
Max Temp at Richmond RAAF
Fig. 23.2 Active and measured temperatures of heating systems
367
rently) and pump seem working well to maintain desired temperature in the facility
(Temperature F&P active), for optimal plant growth. It can also be noted from average
number of pump and cooling (fan) ONs (active) that both cooling systems (fans and
pumps) are synchronised well to maintain desired temperatures. Since the system is
set-up to run fans first and pump if required, it is noted that average number of times
that fans run are greater than that of pumps active throughout the cycle of operation.
This can be an indication of efficient running of cooling system for a protected crop
farcicality that is subject to a significant range of temperatures during the plant cycle
of 8 months. Since the facility is well maintained at desired temperatures during the
whole cycle of more than 8 months, these plants were in a much better conduction
considering the outdoor temperature.
We showed that the system is working as expected, by activing the cooling at
the right times (Fig. 23.1). Similarly, heating of the facility is considered from the
perspective of measured temperature at the facility with temperatures of heating
systems. Since there are two heating systems (Wall and Floor) using hot water, water
temperature at entry and exit of both systems (wall and Floor) are considered.
It is noted from that heating is very active at the start and end of the cycle, given
natural climate conditions during these times. Similar to cooling systems, heating
systems are also working as required for optimum plant growth to generate high level
yield, compared to crop production under natural conditions (Fig. 23.2).
Since temperature range of fairly large during the start and end of the plant cycle,
there is considerable heating power consumption during those times (Fig. 23.3).
While the heating is required to maintain the desired temperature for the capsicum
crop at the greenhouse facility, investigation into selecting the crop, setting the cycle
time with different start time/s and possibility of other influence for changing cycle
time is required for optimising the energy consumption.
Analysis of crop production
The selected crop of capsicum of three varieties was started on 23 August and ended
on 4 May. The entire cycle includes seeding, flowers, fruits and harvesting. It is noted
from yield data that harvesting started on 11 November 2017, after 80 days of the
start and continue for about 6 months (180 days). This suggests that harvesting period
of the crop cycle is significantly larger than that in usual field crop production.
0
5
10
15
20
25
30
35
40
45
50
0
50
100
150
200
250
30/8/2017
3/09/2017
7/09/2017
11/09/2017
15/9/2017
19/9/2017
23/9/2017
27/9/2017
1/10/2017
5/10/2017
9/10/2017
13/10/2017
17/10/2017
21/10/2017
25/10/2017
29/10/2017
2/11/2017
6/11/2017
10/11/2017
14/11/2017
18/11/2017
22/11/2017
26/11/2017
30/11/2017
4/12/2017
8/12/2017
12/12/2017
16/12/2017
20/12/2017
24/12/2017
28/12/2017
1/01/2018
5/01/2018
9/01/2018
13/1/2018
17/1/2018
21/1/2018
25/1/2018
29/1/2018
2/02/2018
6/02/2018
10/02/2018
14/2/2018
18/2/2018
22/2/2018
26/2/2018
2/03/2018
6/03/2018
10/03/2018
14/3/2018
18/3/2018
22/3/2018
26/3/2018
30/3/2018
3/04/2018
7/04/2018
11/04/2018
15/4/2018
19/4/2018
23/4/2018
27/4/2018
1/05/2018
Temperature (°C)
KWH
Date
Floor total (KWH)
Wall total (KWH)
Cal Heat Temp
Max Temp at Richmond RAAF
Fig. 23.2 Active and measured temperatures of heating systems