

366
P. Samaranayake et al.
Table 23.2 Water heating, data collection period: 30/08/17 to 05/05/18. Two heating networks:
return 1 and return 2
Variable
Unit of measure Variable Description
Meas heat t
Celsius (°C)
The calculated value determined by priva
based on the user settings and other influences
that have been included
Meas return 1 (Wall)
Celsius (°C)
The measured water temperature on the return
line of the heating pipes (at exit) on the wall.
This measurement point is just before the
exiting the room
Meas wt 1 (Wall)
Celsius (°C)
The measured water temperature on the supply
line of the heating pipes (at entry) on the wall.
This measurement point is just at the entry of
wall system to the room (same location as the
exit point in the room)
Meas return 2 (Floor)
Celsius (°C)
The measured water temperature on the return
line of the heating pipes (at exit) on the floor.
This measurement point is just before the
exiting the room
Meas wt 2 (Floor)
Celsius (°C)
The measured water temperature on the supply
line of the heating pipes (at entry) on the floor.
This measurement point is just at the entry of
floor system to the room (same location as the
exit point in the room)
Wall (system 1) total (KWH) KWH
The cumulative total kWh consumption for the
day of the wall heating
Floor (system 2) total (KWH) KWH
The cumulative total kWh consumption for the
day of the floor heating
Step 3: Analysis of cooling, heating, power consumption and yield data
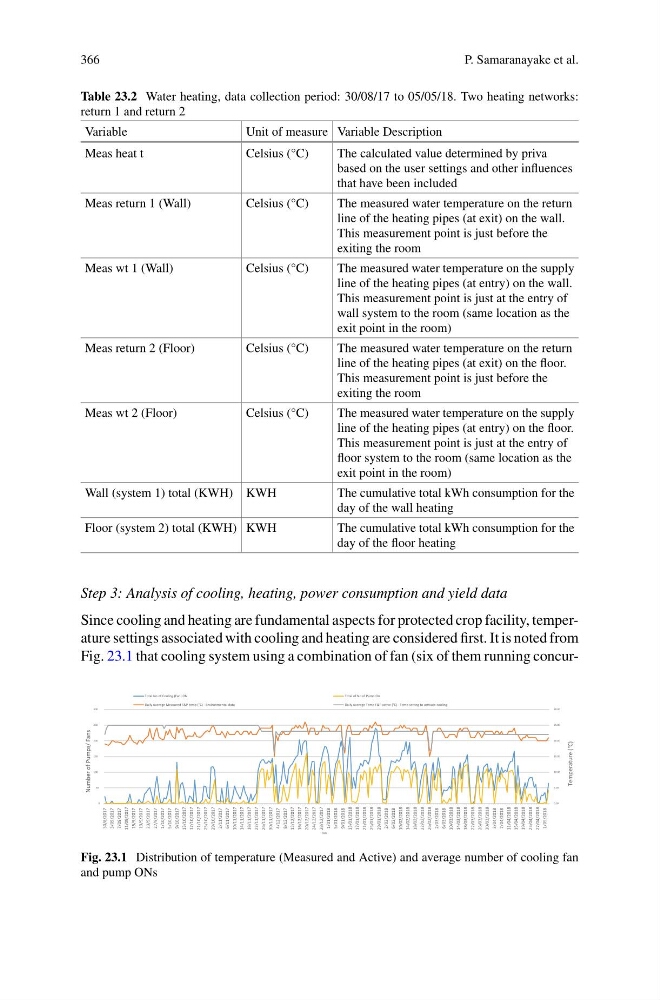
Since cooling and heating are fundamental aspects for protected crop facility, temperature settings associated with cooling and heating are considered first. It is noted from
Fig. 23.1 that cooling system using a combination of fan (six of them running concur0.00
5.00
10.00
15.00
20.00
25.00
30.00
0
50
100
150
200
250
300
30/8/2017
3/09/2017
7/09/2017
11/09/2017
15/9/2017
19/9/2017
23/9/2017
27/9/2017
1/10/2017
5/10/2017
9/10/2017
13/10/2017
17/10/2017
21/10/2017
25/10/2017
29/10/2017
2/11/2017
6/11/2017
10/11/2017
14/11/2017
18/11/2017
22/11/2017
26/11/2017
30/11/2017
4/12/2017
8/12/2017
12/12/2017
16/12/2017
20/12/2017
24/12/2017
28/12/2017
1/01/2018
5/01/2018
9/01/2018
13/01/2018
17/01/2018
21/01/2018
25/01/2018
29/01/2018
2/02/2018
6/02/2018
10/02/2018
14/02/2018
18/02/2018
22/02/2018
26/02/2018
2/03/2018
6/03/2018
10/03/2018
14/03/2018
18/03/2018
22/03/2018
26/03/2018
30/03/2018
3/04/2018
7/04/2018
11/04/2018
15/04/2018
19/04/2018
23/04/2018
27/04/2018
1/05/2018
Temperature (°C)
Number of Pumps/ Fans
Date
Total No of Cooling (Fan) ON
Total of No of Pump On
Daily Average Measured F&P temp (°C) - Environmental data
Daily Average Temp F&P acƟve (°C) - Temp seƫng to acƟvate cooling
Fig. 23.1 Distribution of temperature (Measured and Active) and average number of cooling fan
and pump ONs
P. Samaranayake et al.
Table 23.2 Water heating, data collection period: 30/08/17 to 05/05/18. Two heating networks:
return 1 and return 2
Variable
Unit of measure Variable Description
Meas heat t
Celsius (°C)
The calculated value determined by priva
based on the user settings and other influences
that have been included
Meas return 1 (Wall)
Celsius (°C)
The measured water temperature on the return
line of the heating pipes (at exit) on the wall.
This measurement point is just before the
exiting the room
Meas wt 1 (Wall)
Celsius (°C)
The measured water temperature on the supply
line of the heating pipes (at entry) on the wall.
This measurement point is just at the entry of
wall system to the room (same location as the
exit point in the room)
Meas return 2 (Floor)
Celsius (°C)
The measured water temperature on the return
line of the heating pipes (at exit) on the floor.
This measurement point is just before the
exiting the room
Meas wt 2 (Floor)
Celsius (°C)
The measured water temperature on the supply
line of the heating pipes (at entry) on the floor.
This measurement point is just at the entry of
floor system to the room (same location as the
exit point in the room)
Wall (system 1) total (KWH) KWH
The cumulative total kWh consumption for the
day of the wall heating
Floor (system 2) total (KWH) KWH
The cumulative total kWh consumption for the
day of the floor heating
Step 3: Analysis of cooling, heating, power consumption and yield data
Since cooling and heating are fundamental aspects for protected crop facility, temperature settings associated with cooling and heating are considered first. It is noted from
Fig. 23.1 that cooling system using a combination of fan (six of them running concur0.00
5.00
10.00
15.00
20.00
25.00
30.00
0
50
100
150
200
250
300
30/8/2017
3/09/2017
7/09/2017
11/09/2017
15/9/2017
19/9/2017
23/9/2017
27/9/2017
1/10/2017
5/10/2017
9/10/2017
13/10/2017
17/10/2017
21/10/2017
25/10/2017
29/10/2017
2/11/2017
6/11/2017
10/11/2017
14/11/2017
18/11/2017
22/11/2017
26/11/2017
30/11/2017
4/12/2017
8/12/2017
12/12/2017
16/12/2017
20/12/2017
24/12/2017
28/12/2017
1/01/2018
5/01/2018
9/01/2018
13/01/2018
17/01/2018
21/01/2018
25/01/2018
29/01/2018
2/02/2018
6/02/2018
10/02/2018
14/02/2018
18/02/2018
22/02/2018
26/02/2018
2/03/2018
6/03/2018
10/03/2018
14/03/2018
18/03/2018
22/03/2018
26/03/2018
30/03/2018
3/04/2018
7/04/2018
11/04/2018
15/04/2018
19/04/2018
23/04/2018
27/04/2018
1/05/2018
Temperature (°C)
Number of Pumps/ Fans
Date
Total No of Cooling (Fan) ON
Total of No of Pump On
Daily Average Measured F&P temp (°C) - Environmental data
Daily Average Temp F&P acƟve (°C) - Temp seƫng to acƟvate cooling
Fig. 23.1 Distribution of temperature (Measured and Active) and average number of cooling fan
and pump ONs