

18 Study on the Quantitative Evaluation of Greenhouse Gas (GHG) …
279
18.3.2 Estimation of N 2 O Direct Emissions from Sewage
Treatment Process
The global warming potentials (GWPs) (over 100 years) of CH 4 and N 2 O are 25
times and 298 times that of CO 2 , respectively (IPCC AR4 2007) (IPCC 2007). The
emissions of CH 4 and N 2 O were converted into carbon dioxide equivalents (CO 2 e)
by GWP to estimate GHG emissions in this study.
The N 2 O emission during the sewage treatment occurred in the biological nitrogen
removal process that mainly consisted of nitrification process and denitrification
process. (Kampschreur et al. 2009) This study found that N 2 O was not only generated
as an intermediate product in the denitrification process but was also generated as
a by-product in the nitrification process (He et al. 2001). The mechanism of N 2 O
production as an intermediate product and by-product is complicated, as it is affected
by enzyme inactivation, accumulation of NO 2
− , and reaction condition (such as pH,
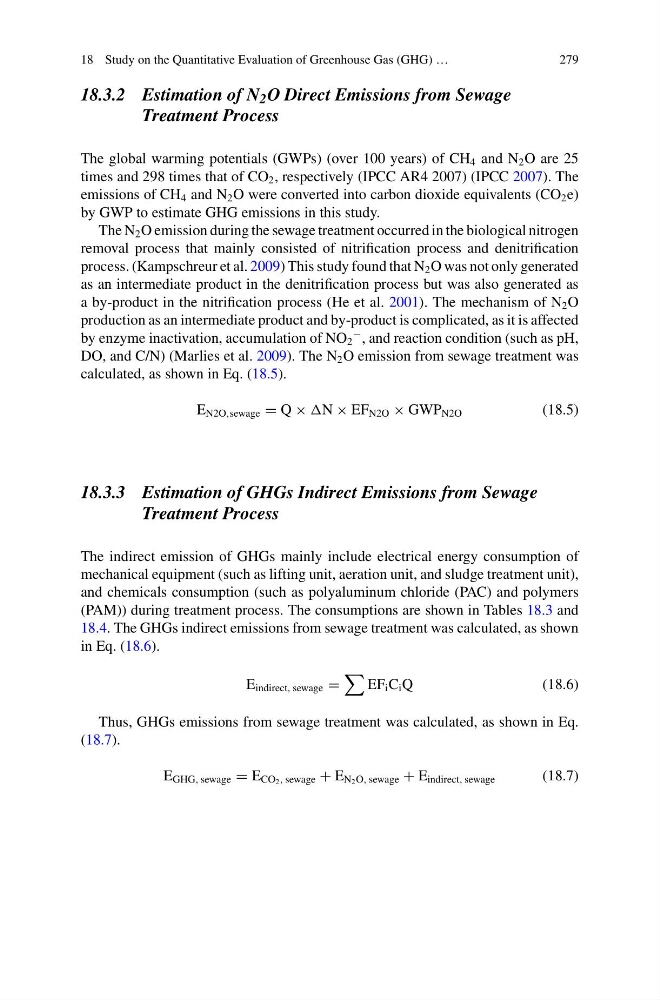
DO, and C/N) (Marlies et al. 2009). The N 2 O emission from sewage treatment was
calculated, as shown in Eq. (18.5).
E N2O,sewage = Q × N × EF N2O × GWP N2O
(18.5)
18.3.3 Estimation of GHGs Indirect Emissions from Sewage
Treatment Process
The indirect emission of GHGs mainly include electrical energy consumption of
mechanical equipment (such as lifting unit, aeration unit, and sludge treatment unit),
and chemicals consumption (such as polyaluminum chloride (PAC) and polymers
(PAM)) during treatment process. The consumptions are shown in Tables 18.3 and
18.4. The GHGs indirect emissions from sewage treatment was calculated, as shown
in Eq. (18.6).
E indirect, sewage =
EF i C i Q
(18.6)
Thus, GHGs emissions from sewage treatment was calculated, as shown in Eq.
(18.7).
E GHG, sewage = E CO 2 , sewage + E N 2 O, sewage + E indirect, sewage
(18.7)
279
18.3.2 Estimation of N 2 O Direct Emissions from Sewage
Treatment Process
The global warming potentials (GWPs) (over 100 years) of CH 4 and N 2 O are 25
times and 298 times that of CO 2 , respectively (IPCC AR4 2007) (IPCC 2007). The
emissions of CH 4 and N 2 O were converted into carbon dioxide equivalents (CO 2 e)
by GWP to estimate GHG emissions in this study.
The N 2 O emission during the sewage treatment occurred in the biological nitrogen
removal process that mainly consisted of nitrification process and denitrification
process. (Kampschreur et al. 2009) This study found that N 2 O was not only generated
as an intermediate product in the denitrification process but was also generated as
a by-product in the nitrification process (He et al. 2001). The mechanism of N 2 O
production as an intermediate product and by-product is complicated, as it is affected
by enzyme inactivation, accumulation of NO 2
− , and reaction condition (such as pH,
DO, and C/N) (Marlies et al. 2009). The N 2 O emission from sewage treatment was
calculated, as shown in Eq. (18.5).
E N2O,sewage = Q × N × EF N2O × GWP N2O
(18.5)
18.3.3 Estimation of GHGs Indirect Emissions from Sewage
Treatment Process
The indirect emission of GHGs mainly include electrical energy consumption of
mechanical equipment (such as lifting unit, aeration unit, and sludge treatment unit),
and chemicals consumption (such as polyaluminum chloride (PAC) and polymers
(PAM)) during treatment process. The consumptions are shown in Tables 18.3 and
18.4. The GHGs indirect emissions from sewage treatment was calculated, as shown
in Eq. (18.6).
E indirect, sewage =
EF i C i Q
(18.6)
Thus, GHGs emissions from sewage treatment was calculated, as shown in Eq.
(18.7).
E GHG, sewage = E CO 2 , sewage + E N 2 O, sewage + E indirect, sewage
(18.7)