

278
Z. Liang et al.
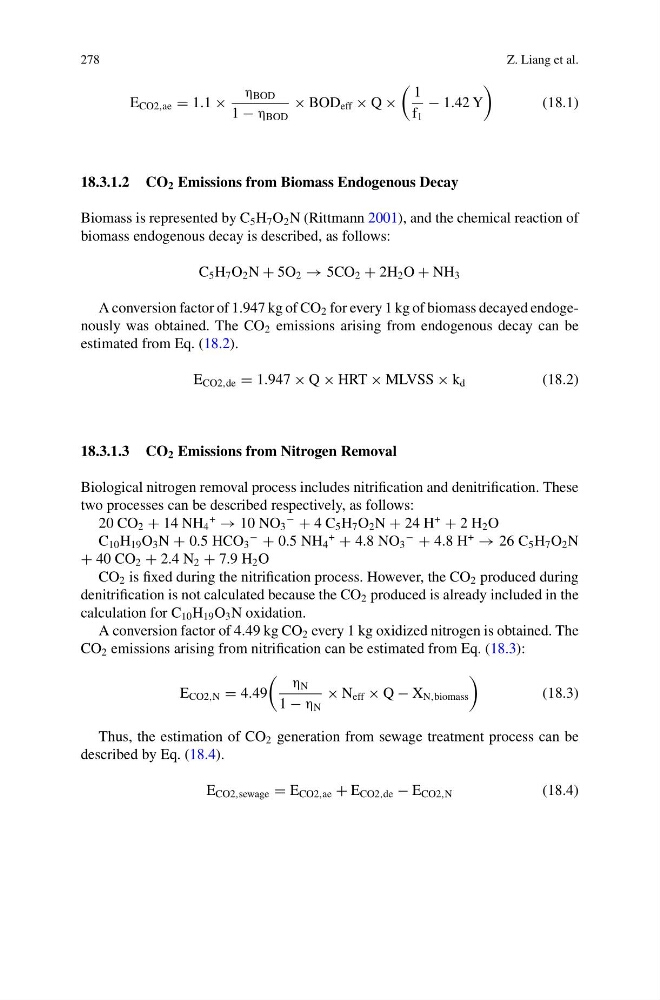
E CO2,ae = 1.1 ×
η BOD
1 − η BOD
× BOD eff × Q ×
1
f 1
− 1.42 Y
(18.1)
18.3.1.2 CO 2 Emissions from Biomass Endogenous Decay
Biomass is represented by C 5 H 7 O 2 N (Rittmann 2001), and the chemical reaction of
biomass endogenous decay is described, as follows:
C 5 H 7 O 2 N + 5O 2 → 5CO 2 + 2H 2 O + NH 3
A conversion factor of 1.947 kg of CO 2 for every 1 kg of biomass decayed endogenously was obtained. The CO 2 emissions arising from endogenous decay can be
estimated from Eq. (18.2).
E CO2,de = 1.947 × Q × HRT × MLVSS × k d
(18.2)
18.3.1.3 CO 2 Emissions from Nitrogen Removal
Biological nitrogen removal process includes nitrification and denitrification. These
two processes can be described respectively, as follows:
20 CO 2 + 14 NH 4
+
→ 10 NO 3
−
+ 4 C 5 H 7 O 2 N + 24 H
+
+ 2 H 2 O
C 10 H 19 O 3 N + 0.5 HCO 3
−
+ 0.5 NH 4
+
+ 4.8 NO 3
−
+ 4.8 H
+
→ 26 C 5 H 7 O 2 N
+ 40 CO 2 + 2.4 N 2 + 7.9 H 2 O
CO 2 is fixed during the nitrification process. However, the CO 2 produced during
denitrification is not calculated because the CO 2 produced is already included in the
calculation for C 10 H 19 O 3 N oxidation.
A conversion factor of 4.49 kg CO 2 every 1 kg oxidized nitrogen is obtained. The
CO 2 emissions arising from nitrification can be estimated from Eq. (18.3):
E CO2,N = 4.49
η N
1 − η N
× N eff × Q − X N,biomass
(18.3)
Thus, the estimation of CO 2 generation from sewage treatment process can be
described by Eq. (18.4).
E CO2,sewage = E CO2,ae + E CO2,de − E CO2,N
(18.4)
Z. Liang et al.
E CO2,ae = 1.1 ×
η BOD
1 − η BOD
× BOD eff × Q ×
1
f 1
− 1.42 Y
(18.1)
18.3.1.2 CO 2 Emissions from Biomass Endogenous Decay
Biomass is represented by C 5 H 7 O 2 N (Rittmann 2001), and the chemical reaction of
biomass endogenous decay is described, as follows:
C 5 H 7 O 2 N + 5O 2 → 5CO 2 + 2H 2 O + NH 3
A conversion factor of 1.947 kg of CO 2 for every 1 kg of biomass decayed endogenously was obtained. The CO 2 emissions arising from endogenous decay can be
estimated from Eq. (18.2).
E CO2,de = 1.947 × Q × HRT × MLVSS × k d
(18.2)
18.3.1.3 CO 2 Emissions from Nitrogen Removal
Biological nitrogen removal process includes nitrification and denitrification. These
two processes can be described respectively, as follows:
20 CO 2 + 14 NH 4
+
→ 10 NO 3
−
+ 4 C 5 H 7 O 2 N + 24 H
+
+ 2 H 2 O
C 10 H 19 O 3 N + 0.5 HCO 3
−
+ 0.5 NH 4
+
+ 4.8 NO 3
−
+ 4.8 H
+
→ 26 C 5 H 7 O 2 N
+ 40 CO 2 + 2.4 N 2 + 7.9 H 2 O
CO 2 is fixed during the nitrification process. However, the CO 2 produced during
denitrification is not calculated because the CO 2 produced is already included in the
calculation for C 10 H 19 O 3 N oxidation.
A conversion factor of 4.49 kg CO 2 every 1 kg oxidized nitrogen is obtained. The
CO 2 emissions arising from nitrification can be estimated from Eq. (18.3):
E CO2,N = 4.49
η N
1 − η N
× N eff × Q − X N,biomass
(18.3)
Thus, the estimation of CO 2 generation from sewage treatment process can be
described by Eq. (18.4).
E CO2,sewage = E CO2,ae + E CO2,de − E CO2,N
(18.4)