

142
A. F. Mohamed and M. I. Rasnan
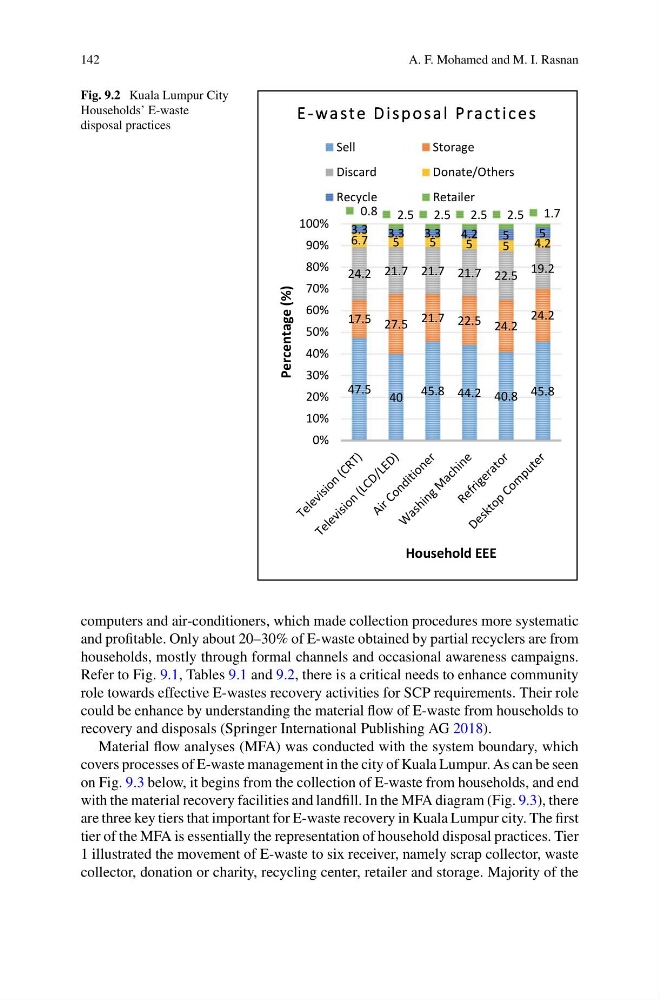
Fig. 9.2 Kuala Lumpur City
Households’ E-waste
disposal practices
47.5 40 45.8 44.2 40.8 45.8
17.5 27.5 21.7 22.5 24.2
24.2
24.2 21.7 21.7 21.7 22.5
19.2
6.7
5
5
5
5
4.2
3.3 3.3 3.3 4.2
5
5
0.8 2.5 2.5 2.5 2.5 1.7
0%
10%
20%
30%
40%
50%
60%
70%
80%
90%
100%
Percentage (%)
Household EEE
E E - w a s t e D i s p o s a l P r a c t i c e s
Sell
Storage
Discard
Donate/Others
Recycle
Retailer
computers and air-conditioners, which made collection procedures more systematic
and profitable. Only about 20–30% of E-waste obtained by partial recyclers are from
households, mostly through formal channels and occasional awareness campaigns.
Refer to Fig. 9.1, Tables 9.1 and 9.2, there is a critical needs to enhance community
role towards effective E-wastes recovery activities for SCP requirements. Their role
could be enhance by understanding the material flow of E-waste from households to
recovery and disposals (Springer International Publishing AG 2018).
Material flow analyses (MFA) was conducted with the system boundary, which
covers processes of E-waste management in the city of Kuala Lumpur. As can be seen
on Fig. 9.3 below, it begins from the collection of E-waste from households, and end
with the material recovery facilities and landfill. In the MFA diagram (Fig. 9.3), there
are three key tiers that important for E-waste recovery in Kuala Lumpur city. The first
tier of the MFA is essentially the representation of household disposal practices. Tier
1 illustrated the movement of E-waste to six receiver, namely scrap collector, waste
collector, donation or charity, recycling center, retailer and storage. Majority of the
A. F. Mohamed and M. I. Rasnan
Fig. 9.2 Kuala Lumpur City
Households’ E-waste
disposal practices
47.5 40 45.8 44.2 40.8 45.8
17.5 27.5 21.7 22.5 24.2
24.2
24.2 21.7 21.7 21.7 22.5
19.2
6.7
5
5
5
5
4.2
3.3 3.3 3.3 4.2
5
5
0.8 2.5 2.5 2.5 2.5 1.7
0%
10%
20%
30%
40%
50%
60%
70%
80%
90%
100%
Percentage (%)
Household EEE
E E - w a s t e D i s p o s a l P r a c t i c e s
Sell
Storage
Discard
Donate/Others
Recycle
Retailer
computers and air-conditioners, which made collection procedures more systematic
and profitable. Only about 20–30% of E-waste obtained by partial recyclers are from
households, mostly through formal channels and occasional awareness campaigns.
Refer to Fig. 9.1, Tables 9.1 and 9.2, there is a critical needs to enhance community
role towards effective E-wastes recovery activities for SCP requirements. Their role
could be enhance by understanding the material flow of E-waste from households to
recovery and disposals (Springer International Publishing AG 2018).
Material flow analyses (MFA) was conducted with the system boundary, which
covers processes of E-waste management in the city of Kuala Lumpur. As can be seen
on Fig. 9.3 below, it begins from the collection of E-waste from households, and end
with the material recovery facilities and landfill. In the MFA diagram (Fig. 9.3), there
are three key tiers that important for E-waste recovery in Kuala Lumpur city. The first
tier of the MFA is essentially the representation of household disposal practices. Tier
1 illustrated the movement of E-waste to six receiver, namely scrap collector, waste
collector, donation or charity, recycling center, retailer and storage. Majority of the