

140
A. F. Mohamed and M. I. Rasnan
Table 9.1 (continued)
Year
Cell Phones
Refrigerators
Total (Tonnes)
2017
2,078
67,465
69,543
2018
2,136
69,219
71,355
2019
2,192
71,019
73,211
2020
2,249
72,866
75,115
Year
Air Conditions
Washing Machines
Total (Tonnes)
c Projection of E-waste in Malaysia, 2010–2020
2010
1,42,982
29,299
1,72,281
2011
1,39,516
29,710
1,69,226
2012
1,40,935
29,633
1,70,568
2013
1,45,559
29,497
1,75,056
2014
1,48,226
31,205
1,79,431
2015
1,46,878
33,153
1,80,031
2016
1,43,483
37,805
1,81,288
2017
1,40,810
49,818
1,90,628
2018
1,40,501
54,362
1,94,863
2019
1,42,402
59,847
2,02,249
2020
1,45,495
65,853
2,11,348
Source (Department of Environment, Malaysia 2018)
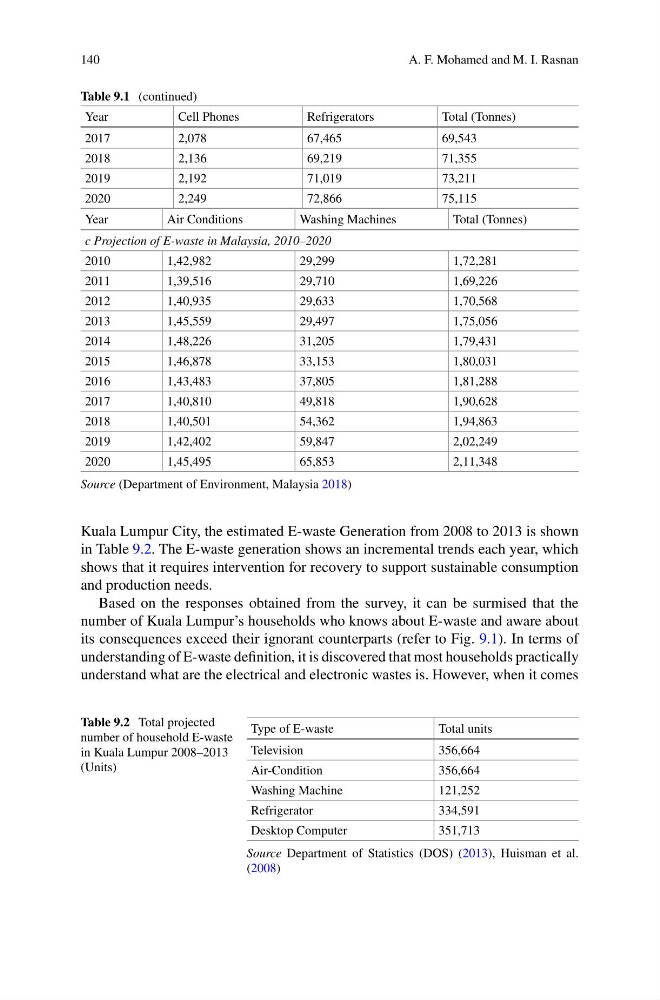
Kuala Lumpur City, the estimated E-waste Generation from 2008 to 2013 is shown
in Table 9.2. The E-waste generation shows an incremental trends each year, which
shows that it requires intervention for recovery to support sustainable consumption
and production needs.
Based on the responses obtained from the survey, it can be surmised that the
number of Kuala Lumpur’s households who knows about E-waste and aware about
its consequences exceed their ignorant counterparts (refer to Fig. 9.1). In terms of
understanding of E-waste definition, it is discovered that most households practically
understand what are the electrical and electronic wastes is. However, when it comes
Table 9.2 Total projected
number of household E-waste
in Kuala Lumpur 2008–2013
(Units)
Type of E-waste
Total units
Television
356,664
Air-Condition
356,664
Washing Machine
121,252
Refrigerator
334,591
Desktop Computer
351,713
Source Department of Statistics (DOS) (2013), Huisman et al.
(2008)
A. F. Mohamed and M. I. Rasnan
Table 9.1 (continued)
Year
Cell Phones
Refrigerators
Total (Tonnes)
2017
2,078
67,465
69,543
2018
2,136
69,219
71,355
2019
2,192
71,019
73,211
2020
2,249
72,866
75,115
Year
Air Conditions
Washing Machines
Total (Tonnes)
c Projection of E-waste in Malaysia, 2010–2020
2010
1,42,982
29,299
1,72,281
2011
1,39,516
29,710
1,69,226
2012
1,40,935
29,633
1,70,568
2013
1,45,559
29,497
1,75,056
2014
1,48,226
31,205
1,79,431
2015
1,46,878
33,153
1,80,031
2016
1,43,483
37,805
1,81,288
2017
1,40,810
49,818
1,90,628
2018
1,40,501
54,362
1,94,863
2019
1,42,402
59,847
2,02,249
2020
1,45,495
65,853
2,11,348
Source (Department of Environment, Malaysia 2018)
Kuala Lumpur City, the estimated E-waste Generation from 2008 to 2013 is shown
in Table 9.2. The E-waste generation shows an incremental trends each year, which
shows that it requires intervention for recovery to support sustainable consumption
and production needs.
Based on the responses obtained from the survey, it can be surmised that the
number of Kuala Lumpur’s households who knows about E-waste and aware about
its consequences exceed their ignorant counterparts (refer to Fig. 9.1). In terms of
understanding of E-waste definition, it is discovered that most households practically
understand what are the electrical and electronic wastes is. However, when it comes
Table 9.2 Total projected
number of household E-waste
in Kuala Lumpur 2008–2013
(Units)
Type of E-waste
Total units
Television
356,664
Air-Condition
356,664
Washing Machine
121,252
Refrigerator
334,591
Desktop Computer
351,713
Source Department of Statistics (DOS) (2013), Huisman et al.
(2008)