

9 Enhancing Role and Participation of Industry and Community …
139
activities. Based on these conditions, six items have been identified. They were televisions (CRT and LED/LCD), refrigerators, washing machines, air-conditioners, and
desktop computers in the current system, which can serve as a guide for improvement
measures.
9.3 Results and Discussion
There are 146 E-waste recovery facilities in Malaysia with the total capacity to handle
more than 24,000 metric ton of E-waste per month licensed by the Department of
Environment Malaysia (DoE). From this, 128 are partial recovery, small and medium
size operators engaged in physical or manual segregation of E-wastes for further
processing. 18 full recovery facilities which can process the E-wastes to recover
the precious metals (Department of Environment (DOE) 2015). The overall picture
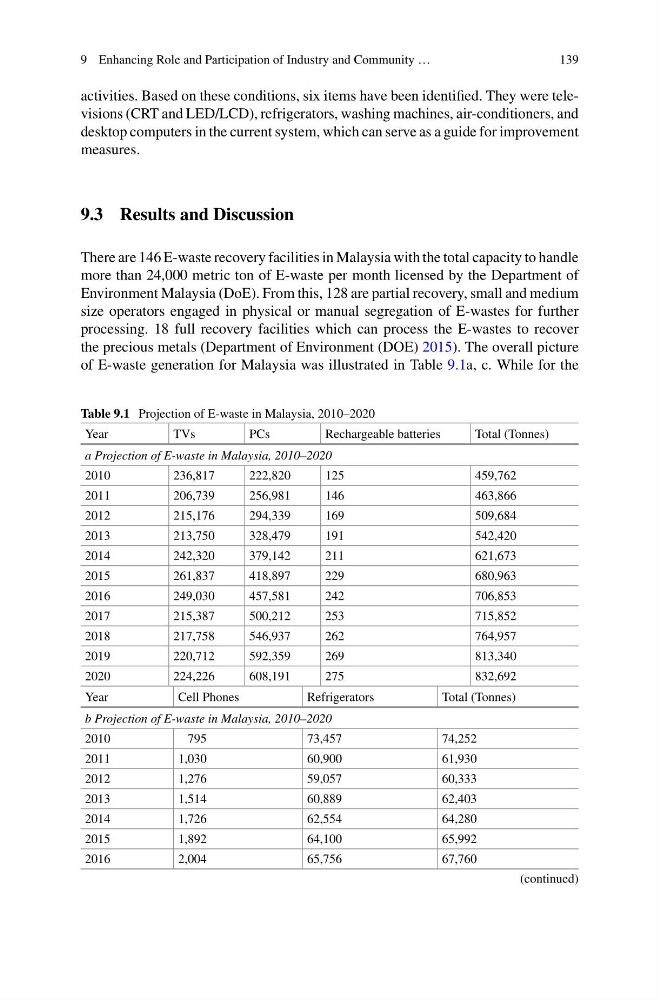
of E-waste generation for Malaysia was illustrated in Table 9.1a, c. While for the
Table 9.1 Projection of E-waste in Malaysia, 2010–2020
Year
TVs
PCs
Rechargeable batteries
Total (Tonnes)
a Projection of E-waste in Malaysia, 2010–2020
2010
236,817
222,820
125
459,762
2011
206,739
256,981
146
463,866
2012
215,176
294,339
169
509,684
2013
213,750
328,479
191
542,420
2014
242,320
379,142
211
621,673
2015
261,837
418,897
229
680,963
2016
249,030
457,581
242
706,853
2017
215,387
500,212
253
715,852
2018
217,758
546,937
262
764,957
2019
220,712
592,359
269
813,340
2020
224,226
608,191
275
832,692
Year
Cell Phones
Refrigerators
Total (Tonnes)
b Projection of E-waste in Malaysia, 2010–2020
2010
795
73,457
74,252
2011
1,030
60,900
61,930
2012
1,276
59,057
60,333
2013
1,514
60,889
62,403
2014
1,726
62,554
64,280
2015
1,892
64,100
65,992
2016
2,004
65,756
67,760
(continued)
139
activities. Based on these conditions, six items have been identified. They were televisions (CRT and LED/LCD), refrigerators, washing machines, air-conditioners, and
desktop computers in the current system, which can serve as a guide for improvement
measures.
9.3 Results and Discussion
There are 146 E-waste recovery facilities in Malaysia with the total capacity to handle
more than 24,000 metric ton of E-waste per month licensed by the Department of
Environment Malaysia (DoE). From this, 128 are partial recovery, small and medium
size operators engaged in physical or manual segregation of E-wastes for further
processing. 18 full recovery facilities which can process the E-wastes to recover
the precious metals (Department of Environment (DOE) 2015). The overall picture
of E-waste generation for Malaysia was illustrated in Table 9.1a, c. While for the
Table 9.1 Projection of E-waste in Malaysia, 2010–2020
Year
TVs
PCs
Rechargeable batteries
Total (Tonnes)
a Projection of E-waste in Malaysia, 2010–2020
2010
236,817
222,820
125
459,762
2011
206,739
256,981
146
463,866
2012
215,176
294,339
169
509,684
2013
213,750
328,479
191
542,420
2014
242,320
379,142
211
621,673
2015
261,837
418,897
229
680,963
2016
249,030
457,581
242
706,853
2017
215,387
500,212
253
715,852
2018
217,758
546,937
262
764,957
2019
220,712
592,359
269
813,340
2020
224,226
608,191
275
832,692
Year
Cell Phones
Refrigerators
Total (Tonnes)
b Projection of E-waste in Malaysia, 2010–2020
2010
795
73,457
74,252
2011
1,030
60,900
61,930
2012
1,276
59,057
60,333
2013
1,514
60,889
62,403
2014
1,726
62,554
64,280
2015
1,892
64,100
65,992
2016
2,004
65,756
67,760
(continued)