

8 Analysis of the Personal Cars Sustainability in Relation …
129
Table 8.5 Relative frequency of samples sustainability levels in each cluster
Cluster
Percentage in samples (%)
Sustainability in clusters
High (%)
Middle (%)
Low (%)
CL1
35.56
18.8
56.3
25
CL2
13.33
33.3
50
16.7
CL3
35.56
43.8
43.8
12.5
CL4
13.33
0
66.7
33.3
CL5
2.22
0
100
0
Table 8.6 Relative frequency of samples sustainability levels in each quarter
Quarter
Percentage in samples (%)
Sustainability in quarter
High (%)
Middle (%)
Low (%)
Q1
24.44
18.2
36.4
45.5
Q2
22.22
10.0
70.0
20.0
Q3
26.67
50.0
41.7
8.3
Q4
26.67
25.0
66.7
8.3
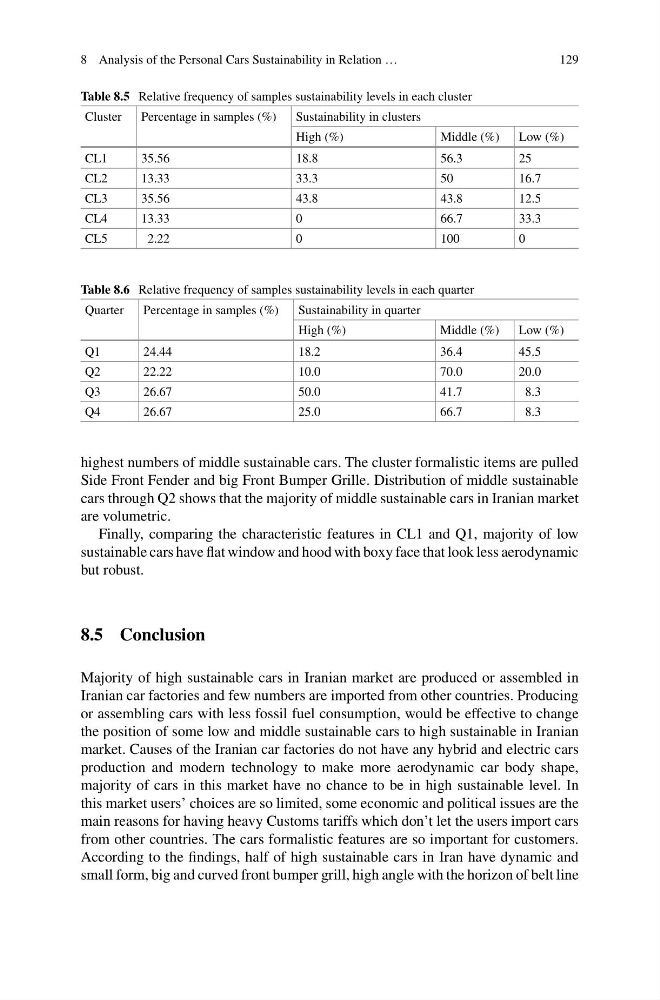
highest numbers of middle sustainable cars. The cluster formalistic items are pulled
Side Front Fender and big Front Bumper Grille. Distribution of middle sustainable
cars through Q2 shows that the majority of middle sustainable cars in Iranian market
are volumetric.
Finally, comparing the characteristic features in CL1 and Q1, majority of low
sustainable cars have flat window and hood with boxy face that look less aerodynamic
but robust.
8.5 Conclusion
Majority of high sustainable cars in Iranian market are produced or assembled in
Iranian car factories and few numbers are imported from other countries. Producing
or assembling cars with less fossil fuel consumption, would be effective to change
the position of some low and middle sustainable cars to high sustainable in Iranian
market. Causes of the Iranian car factories do not have any hybrid and electric cars
production and modern technology to make more aerodynamic car body shape,
majority of cars in this market have no chance to be in high sustainable level. In
this market users’ choices are so limited, some economic and political issues are the
main reasons for having heavy Customs tariffs which don’t let the users import cars
from other countries. The cars formalistic features are so important for customers.
According to the findings, half of high sustainable cars in Iran have dynamic and
small form, big and curved front bumper grill, high angle with the horizon of belt line
129
Table 8.5 Relative frequency of samples sustainability levels in each cluster
Cluster
Percentage in samples (%)
Sustainability in clusters
High (%)
Middle (%)
Low (%)
CL1
35.56
18.8
56.3
25
CL2
13.33
33.3
50
16.7
CL3
35.56
43.8
43.8
12.5
CL4
13.33
0
66.7
33.3
CL5
2.22
0
100
0
Table 8.6 Relative frequency of samples sustainability levels in each quarter
Quarter
Percentage in samples (%)
Sustainability in quarter
High (%)
Middle (%)
Low (%)
Q1
24.44
18.2
36.4
45.5
Q2
22.22
10.0
70.0
20.0
Q3
26.67
50.0
41.7
8.3
Q4
26.67
25.0
66.7
8.3
highest numbers of middle sustainable cars. The cluster formalistic items are pulled
Side Front Fender and big Front Bumper Grille. Distribution of middle sustainable
cars through Q2 shows that the majority of middle sustainable cars in Iranian market
are volumetric.
Finally, comparing the characteristic features in CL1 and Q1, majority of low
sustainable cars have flat window and hood with boxy face that look less aerodynamic
but robust.
8.5 Conclusion
Majority of high sustainable cars in Iranian market are produced or assembled in
Iranian car factories and few numbers are imported from other countries. Producing
or assembling cars with less fossil fuel consumption, would be effective to change
the position of some low and middle sustainable cars to high sustainable in Iranian
market. Causes of the Iranian car factories do not have any hybrid and electric cars
production and modern technology to make more aerodynamic car body shape,
majority of cars in this market have no chance to be in high sustainable level. In
this market users’ choices are so limited, some economic and political issues are the
main reasons for having heavy Customs tariffs which don’t let the users import cars
from other countries. The cars formalistic features are so important for customers.
According to the findings, half of high sustainable cars in Iran have dynamic and
small form, big and curved front bumper grill, high angle with the horizon of belt line