

128
M. Zolfaghari and S. J. Zafarmand
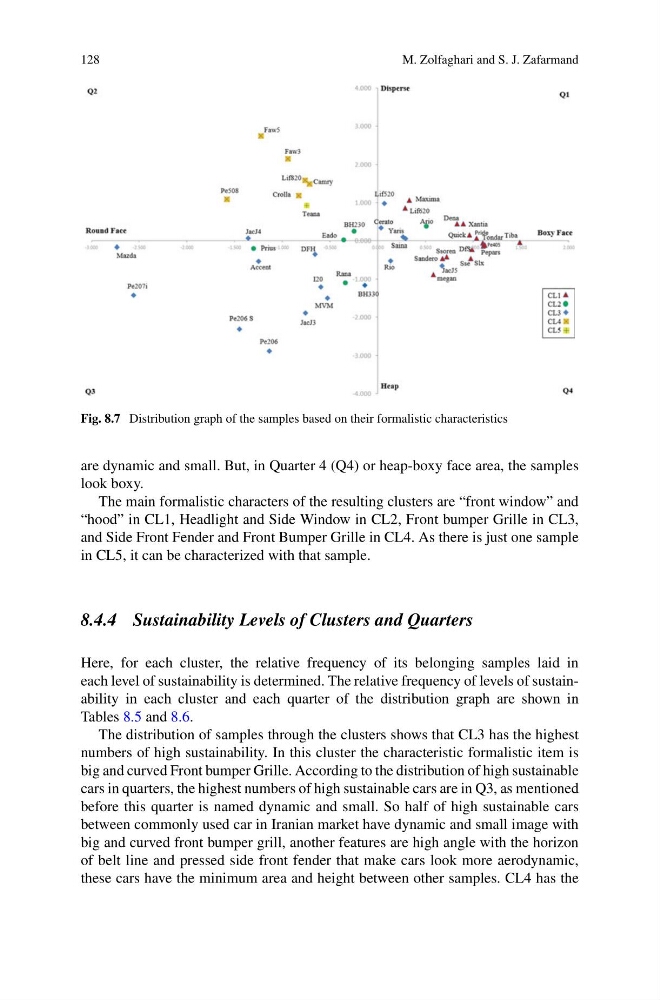
Fig. 8.7 Distribution graph of the samples based on their formalistic characteristics
are dynamic and small. But, in Quarter 4 (Q4) or heap-boxy face area, the samples
look boxy.
The main formalistic characters of the resulting clusters are “front window” and
“hood” in CL1, Headlight and Side Window in CL2, Front bumper Grille in CL3,
and Side Front Fender and Front Bumper Grille in CL4. As there is just one sample
in CL5, it can be characterized with that sample.
8.4.4 Sustainability Levels of Clusters and Quarters
Here, for each cluster, the relative frequency of its belonging samples laid in
each level of sustainability is determined. The relative frequency of levels of sustainability in each cluster and each quarter of the distribution graph are shown in
Tables 8.5 and 8.6.
The distribution of samples through the clusters shows that CL3 has the highest
numbers of high sustainability. In this cluster the characteristic formalistic item is
big and curved Front bumper Grille. According to the distribution of high sustainable
cars in quarters, the highest numbers of high sustainable cars are in Q3, as mentioned
before this quarter is named dynamic and small. So half of high sustainable cars
between commonly used car in Iranian market have dynamic and small image with
big and curved front bumper grill, another features are high angle with the horizon
of belt line and pressed side front fender that make cars look more aerodynamic,
these cars have the minimum area and height between other samples. CL4 has the
M. Zolfaghari and S. J. Zafarmand
Fig. 8.7 Distribution graph of the samples based on their formalistic characteristics
are dynamic and small. But, in Quarter 4 (Q4) or heap-boxy face area, the samples
look boxy.
The main formalistic characters of the resulting clusters are “front window” and
“hood” in CL1, Headlight and Side Window in CL2, Front bumper Grille in CL3,
and Side Front Fender and Front Bumper Grille in CL4. As there is just one sample
in CL5, it can be characterized with that sample.
8.4.4 Sustainability Levels of Clusters and Quarters
Here, for each cluster, the relative frequency of its belonging samples laid in
each level of sustainability is determined. The relative frequency of levels of sustainability in each cluster and each quarter of the distribution graph are shown in
Tables 8.5 and 8.6.
The distribution of samples through the clusters shows that CL3 has the highest
numbers of high sustainability. In this cluster the characteristic formalistic item is
big and curved Front bumper Grille. According to the distribution of high sustainable
cars in quarters, the highest numbers of high sustainable cars are in Q3, as mentioned
before this quarter is named dynamic and small. So half of high sustainable cars
between commonly used car in Iranian market have dynamic and small image with
big and curved front bumper grill, another features are high angle with the horizon
of belt line and pressed side front fender that make cars look more aerodynamic,
these cars have the minimum area and height between other samples. CL4 has the