

8 Analysis of the Personal Cars Sustainability in Relation …
127
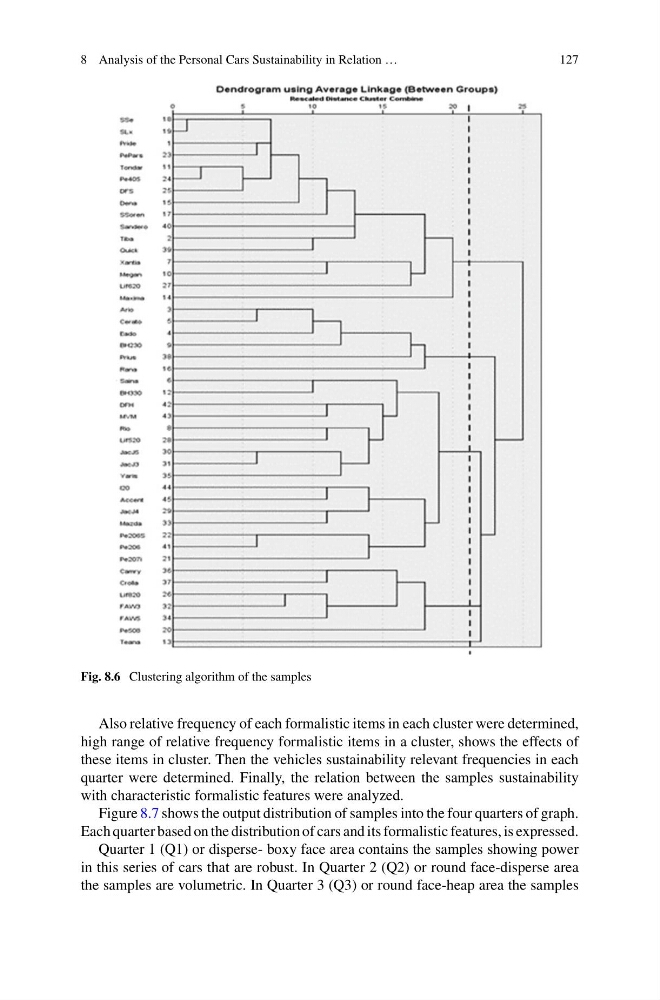
Fig. 8.6 Clustering algorithm of the samples
Also relative frequency of each formalistic items in each cluster were determined,
high range of relative frequency formalistic items in a cluster, shows the effects of
these items in cluster. Then the vehicles sustainability relevant frequencies in each
quarter were determined. Finally, the relation between the samples sustainability
with characteristic formalistic features were analyzed.
Figure 8.7 shows the output distribution of samples into the four quarters of graph.
Each quarter based on the distribution of cars and its formalistic features, is expressed.
Quarter 1 (Q1) or disperse- boxy face area contains the samples showing power
in this series of cars that are robust. In Quarter 2 (Q2) or round face-disperse area
the samples are volumetric. In Quarter 3 (Q3) or round face-heap area the samples
127
Fig. 8.6 Clustering algorithm of the samples
Also relative frequency of each formalistic items in each cluster were determined,
high range of relative frequency formalistic items in a cluster, shows the effects of
these items in cluster. Then the vehicles sustainability relevant frequencies in each
quarter were determined. Finally, the relation between the samples sustainability
with characteristic formalistic features were analyzed.
Figure 8.7 shows the output distribution of samples into the four quarters of graph.
Each quarter based on the distribution of cars and its formalistic features, is expressed.
Quarter 1 (Q1) or disperse- boxy face area contains the samples showing power
in this series of cars that are robust. In Quarter 2 (Q2) or round face-disperse area
the samples are volumetric. In Quarter 3 (Q3) or round face-heap area the samples