

392
5 X-ray Pulsar-Based Navigation: Theories and Experiments
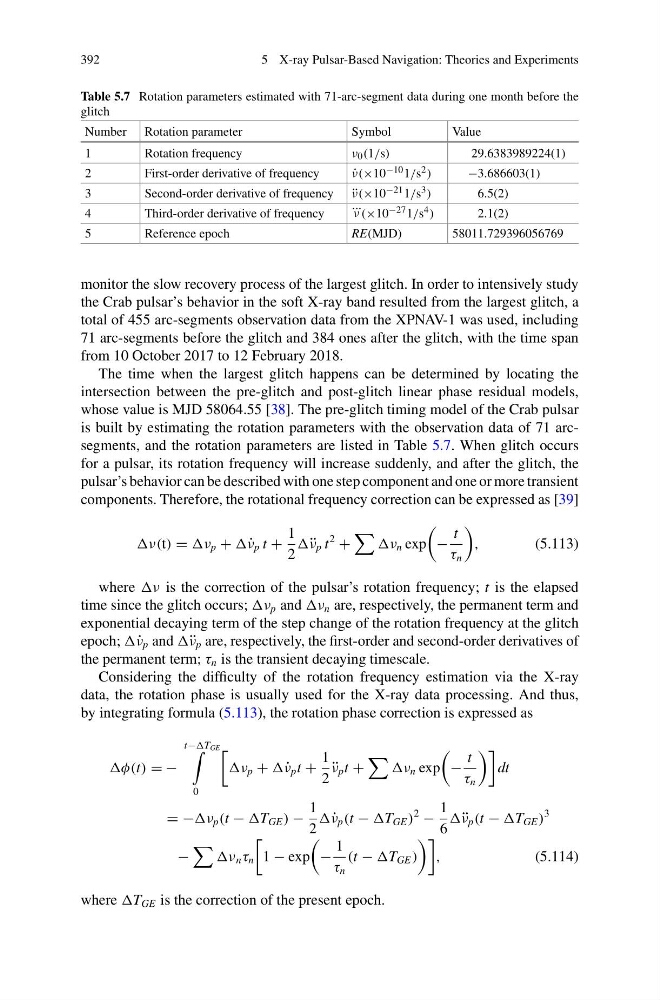
Table 5.7 Rotation parameters estimated with 71-arc-segment data during one month before the
glitch
Number Rotation parameter
Symbol
Value
1
Rotation frequency
ν 0 (1/s)
29.6383989224(1)
2
First-order derivative of frequency
˙
ν(×10 −10 1/s 2 )
−3.686603(1)
3
Second-order derivative of frequency
¨
ν(×10 −21 1/s 3 )
6.5(2)
4
Third-order derivative of frequency
...
ν (×10 −27 1/s 4 )
2.1(2)
5
Reference epoch
RE(MJD)
58011.729396056769
monitor the slow recovery process of the largest glitch. In order to intensively study
the Crab pulsar’s behavior in the soft X-ray band resulted from the largest glitch, a
total of 455 arc-segments observation data from the XPNAV-1 was used, including
71 arc-segments before the glitch and 384 ones after the glitch, with the time span
from 10 October 2017 to 12 February 2018.
The time when the largest glitch happens can be determined by locating the
intersection between the pre-glitch and post-glitch linear phase residual models,
whose value is MJD 58064.55 [38]. The pre-glitch timing model of the Crab pulsar
is built by estimating the rotation parameters with the observation data of 71 arcsegments, and the rotation parameters are listed in Table 5.7. When glitch occurs
for a pulsar, its rotation frequency will increase suddenly, and after the glitch, the
pulsar’s behavior can be described with one step component and one or more transient
components. Therefore, the rotational frequency correction can be expressed as [39]
ν(t) = ν p + ˙ ν p t +
1
2
¨ ν p t
2
+
ν n exp
−
t
τ n
,
(5.113)
where ν is the correction of the pulsar’s rotation frequency; t is the elapsed
time since the glitch occurs; ν p and ν n are, respectively, the permanent term and
exponential decaying term of the step change of the rotation frequency at the glitch
epoch; ˙ ν p and ¨ ν p are, respectively, the first-order and second-order derivatives of
the permanent term; τ n is the transient decaying timescale.
Considering the difficulty of the rotation frequency estimation via the X-ray
data, the rotation phase is usually used for the X-ray data processing. And thus,
by integrating formula (5.113), the rotation phase correction is expressed as
φ(t) = −
t−T GE
0
ν p + ˙ ν p t +
1
2
¨
ν p t +
ν n exp
−
t
τ n
dt
= −ν p (t − T GE ) −
1
2
˙ ν p (t − T GE )
2
−
1
6
¨ ν p (t − T GE )
3
−
ν n τ n
1 − exp
−
1
τ n
(t − T GE )
,
(5.114)
where T GE is the correction of the present epoch.
5 X-ray Pulsar-Based Navigation: Theories and Experiments
Table 5.7 Rotation parameters estimated with 71-arc-segment data during one month before the
glitch
Number Rotation parameter
Symbol
Value
1
Rotation frequency
ν 0 (1/s)
29.6383989224(1)
2
First-order derivative of frequency
˙
ν(×10 −10 1/s 2 )
−3.686603(1)
3
Second-order derivative of frequency
¨
ν(×10 −21 1/s 3 )
6.5(2)
4
Third-order derivative of frequency
...
ν (×10 −27 1/s 4 )
2.1(2)
5
Reference epoch
RE(MJD)
58011.729396056769
monitor the slow recovery process of the largest glitch. In order to intensively study
the Crab pulsar’s behavior in the soft X-ray band resulted from the largest glitch, a
total of 455 arc-segments observation data from the XPNAV-1 was used, including
71 arc-segments before the glitch and 384 ones after the glitch, with the time span
from 10 October 2017 to 12 February 2018.
The time when the largest glitch happens can be determined by locating the
intersection between the pre-glitch and post-glitch linear phase residual models,
whose value is MJD 58064.55 [38]. The pre-glitch timing model of the Crab pulsar
is built by estimating the rotation parameters with the observation data of 71 arcsegments, and the rotation parameters are listed in Table 5.7. When glitch occurs
for a pulsar, its rotation frequency will increase suddenly, and after the glitch, the
pulsar’s behavior can be described with one step component and one or more transient
components. Therefore, the rotational frequency correction can be expressed as [39]
ν(t) = ν p + ˙ ν p t +
1
2
¨ ν p t
2
+
ν n exp
−
t
τ n
,
(5.113)
where ν is the correction of the pulsar’s rotation frequency; t is the elapsed
time since the glitch occurs; ν p and ν n are, respectively, the permanent term and
exponential decaying term of the step change of the rotation frequency at the glitch
epoch; ˙ ν p and ¨ ν p are, respectively, the first-order and second-order derivatives of
the permanent term; τ n is the transient decaying timescale.
Considering the difficulty of the rotation frequency estimation via the X-ray
data, the rotation phase is usually used for the X-ray data processing. And thus,
by integrating formula (5.113), the rotation phase correction is expressed as
φ(t) = −
t−T GE
0
ν p + ˙ ν p t +
1
2
¨
ν p t +
ν n exp
−
t
τ n
dt
= −ν p (t − T GE ) −
1
2
˙ ν p (t − T GE )
2
−
1
6
¨ ν p (t − T GE )
3
−
ν n τ n
1 − exp
−
1
τ n
(t − T GE )
,
(5.114)
where T GE is the correction of the present epoch.