

5.2.2 Diffuse Reflectance Spectra
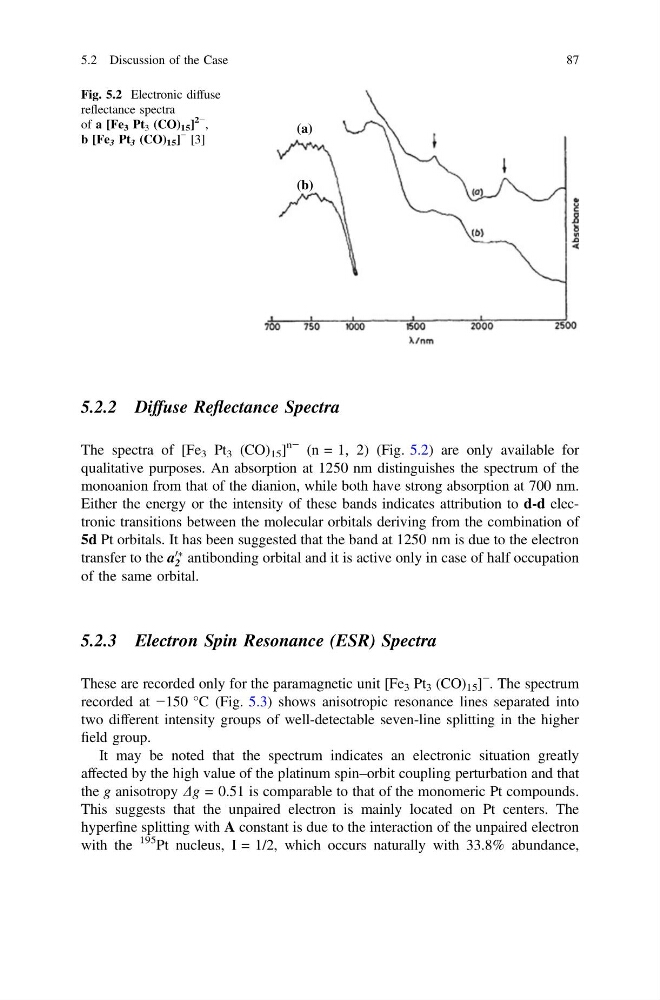
The spectra of [Fe 3 Pt 3 (CO) 15 ]
n− (n = 1, 2) (Fig. 5.2) are only available for
qualitative purposes. An absorption at 1250 nm distinguishes the spectrum of the
monoanion from that of the dianion, while both have strong absorption at 700 nm.
Either the energy or the intensity of these bands indicates attribution to d-d electronic transitions between the molecular orbitals deriving from the combination of
5d Pt orbitals. It has been suggested that the band at 1250 nm is due to the electron
transfer to the a
0Ã
2 antibonding orbital and it is active only in case of half occupation
of the same orbital.
5.2.3 Electron Spin Resonance (ESR) Spectra
These are recorded only for the paramagnetic unit [Fe 3 Pt 3 (CO) 15 ]
−
. The spectrum
recorded at −150 °C (Fig. 5.3) shows anisotropic resonance lines separated into
two different intensity groups of well-detectable seven-line splitting in the higher
field group.
It may be noted that the spectrum indicates an electronic situation greatly
affected by the high value of the platinum spin–orbit coupling perturbation and that
the g anisotropy Dg = 0.51 is comparable to that of the monomeric Pt compounds.
This suggests that the unpaired electron is mainly located on Pt centers. The
hyperfine splitting with A constant is due to the interaction of the unpaired electron
with the
195 Pt nucleus, I = 1/2, which occurs naturally with 33.8% abundance,
(b)
(a)
Fig. 5.2 Electronic diffuse
reflectance spectra
of a [Fe 3 Pt 3 (CO) 15 ]
2−
,
b [Fe 3 Pt 3 (CO) 15 ]
− [3]
5.2 Discussion of the Case
87
The spectra of [Fe 3 Pt 3 (CO) 15 ]
n− (n = 1, 2) (Fig. 5.2) are only available for
qualitative purposes. An absorption at 1250 nm distinguishes the spectrum of the
monoanion from that of the dianion, while both have strong absorption at 700 nm.
Either the energy or the intensity of these bands indicates attribution to d-d electronic transitions between the molecular orbitals deriving from the combination of
5d Pt orbitals. It has been suggested that the band at 1250 nm is due to the electron
transfer to the a
0Ã
2 antibonding orbital and it is active only in case of half occupation
of the same orbital.
5.2.3 Electron Spin Resonance (ESR) Spectra
These are recorded only for the paramagnetic unit [Fe 3 Pt 3 (CO) 15 ]
−
. The spectrum
recorded at −150 °C (Fig. 5.3) shows anisotropic resonance lines separated into
two different intensity groups of well-detectable seven-line splitting in the higher
field group.
It may be noted that the spectrum indicates an electronic situation greatly
affected by the high value of the platinum spin–orbit coupling perturbation and that
the g anisotropy Dg = 0.51 is comparable to that of the monomeric Pt compounds.
This suggests that the unpaired electron is mainly located on Pt centers. The
hyperfine splitting with A constant is due to the interaction of the unpaired electron
with the
195 Pt nucleus, I = 1/2, which occurs naturally with 33.8% abundance,
(b)
(a)
Fig. 5.2 Electronic diffuse
reflectance spectra
of a [Fe 3 Pt 3 (CO) 15 ]
2−
,
b [Fe 3 Pt 3 (CO) 15 ]
− [3]
5.2 Discussion of the Case
87