

3.4. SPECTROSCOPY
59
From Eq. (3.8) the frequency difference is given by lvinc - vemit) = In’ - n”Ivo = vo
since the same infrared selection rule An = f l is obeyed. Two cases are observed:
(1) vinc > vemit corresponding to a Stokes line, and (2) vine < vemit for an anti-Stokes
line. Infrared active vibrational modes arise from a change in the electric dipole
moment p of the molecule, while Raman-active vibrational modes involve a change
in the polarizability P = pind/E, where the electric vector E of the incident light
induces the dipole moment pind in the sample. Thus some vibrational modes are IRactive, that is, measurable by infrared spectroscopy, and some are Raman-active.
Infrared and optical spectroscopy is often carried out by reflection, and the
measurements of nanostructures provide the reflectance (or reflectivity) R, which is
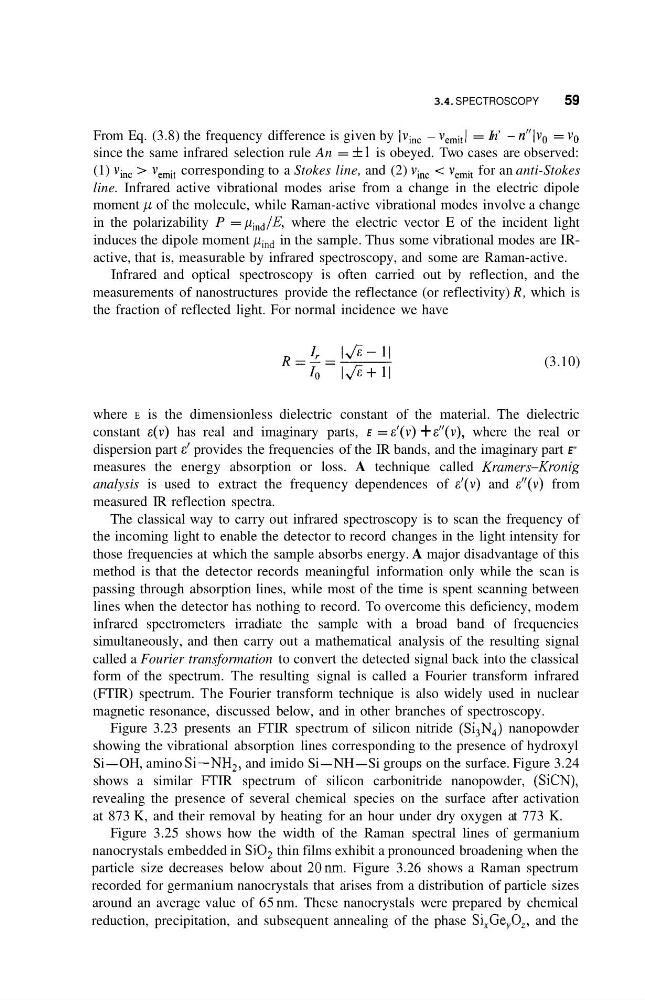
the fraction of reflected light. For normal incidence we have
(3.10)
where E is the dimensionless dielectric constant of the material. The dielectric
constant E(V) has real and imaginary parts, E = E’(v) + ~ ” ( v ) , where the real or
dispersion part E’ provides the frequencies of the IR bands, and the imaginary part E”
measures the energy absorption or loss. A technique called Kramers-Kronig
analysis is used to extract the frequency dependences of E’(v) and ~ ” ( v ) from
measured IR reflection spectra.
The classical way to carry out infrared spectroscopy is to scan the frequency of
the incoming light to enable the detector to record changes in the light intensity for
those frequencies at which the sample absorbs energy. A major disadvantage of this
method is that the detector records meaningful information only while the scan is
passing through absorption lines, while most of the time is spent scanning between
lines when the detector has nothing to record. To overcome this deficiency, modem
infrared spectrometers irradiate the sample with a broad band of frequencies
simultaneously, and then carry out a mathematical analysis of the resulting signal
called a Fourier transformation to convert the detected signal back into the classical
form of the spectrum. The resulting signal is called a Fourier transform infrared
(FTIR) spectrum. The Fourier transform technique is also widely used in nuclear
magnetic resonance, discussed below, and in other branches of spectroscopy.
Figure 3.23 presents an FTIR spectrum of silicon nitride (Si,N,) nanopowder
showing the vibrational absorption lines corresponding to the presence of hydroxyl
Si-OH, amino Si-”,,
and imido Si-NH-Si groups on the surface. Figure 3.24
shows a similar FTIR spectrum of silicon carbonitride nanopowder, (SiCN),
revealing the presence of several chemical species on the surface after activation
at 873 K, and their removal by heating for an hour under dry oxygen at 773 K.
Figure 3.25 shows how the width of the Raman spectral lines of germanium
nanocrystals embedded in SiO, thin films exhibit a pronounced broadening when the
particle size decreases below about 20nm. Figure 3.26 shows a Raman spectrum
recorded for germanium nanocrystals that arises from a distribution of particle sizes
around an average value of 65 nm. These nanocrystals were prepared by chemical
reduction, precipitation, and subsequent annealing of the phase Si,Ge,O,, and the
59
From Eq. (3.8) the frequency difference is given by lvinc - vemit) = In’ - n”Ivo = vo
since the same infrared selection rule An = f l is obeyed. Two cases are observed:
(1) vinc > vemit corresponding to a Stokes line, and (2) vine < vemit for an anti-Stokes
line. Infrared active vibrational modes arise from a change in the electric dipole
moment p of the molecule, while Raman-active vibrational modes involve a change
in the polarizability P = pind/E, where the electric vector E of the incident light
induces the dipole moment pind in the sample. Thus some vibrational modes are IRactive, that is, measurable by infrared spectroscopy, and some are Raman-active.
Infrared and optical spectroscopy is often carried out by reflection, and the
measurements of nanostructures provide the reflectance (or reflectivity) R, which is
the fraction of reflected light. For normal incidence we have
(3.10)
where E is the dimensionless dielectric constant of the material. The dielectric
constant E(V) has real and imaginary parts, E = E’(v) + ~ ” ( v ) , where the real or
dispersion part E’ provides the frequencies of the IR bands, and the imaginary part E”
measures the energy absorption or loss. A technique called Kramers-Kronig
analysis is used to extract the frequency dependences of E’(v) and ~ ” ( v ) from
measured IR reflection spectra.
The classical way to carry out infrared spectroscopy is to scan the frequency of
the incoming light to enable the detector to record changes in the light intensity for
those frequencies at which the sample absorbs energy. A major disadvantage of this
method is that the detector records meaningful information only while the scan is
passing through absorption lines, while most of the time is spent scanning between
lines when the detector has nothing to record. To overcome this deficiency, modem
infrared spectrometers irradiate the sample with a broad band of frequencies
simultaneously, and then carry out a mathematical analysis of the resulting signal
called a Fourier transformation to convert the detected signal back into the classical
form of the spectrum. The resulting signal is called a Fourier transform infrared
(FTIR) spectrum. The Fourier transform technique is also widely used in nuclear
magnetic resonance, discussed below, and in other branches of spectroscopy.
Figure 3.23 presents an FTIR spectrum of silicon nitride (Si,N,) nanopowder
showing the vibrational absorption lines corresponding to the presence of hydroxyl
Si-OH, amino Si-”,,
and imido Si-NH-Si groups on the surface. Figure 3.24
shows a similar FTIR spectrum of silicon carbonitride nanopowder, (SiCN),
revealing the presence of several chemical species on the surface after activation
at 873 K, and their removal by heating for an hour under dry oxygen at 773 K.
Figure 3.25 shows how the width of the Raman spectral lines of germanium
nanocrystals embedded in SiO, thin films exhibit a pronounced broadening when the
particle size decreases below about 20nm. Figure 3.26 shows a Raman spectrum
recorded for germanium nanocrystals that arises from a distribution of particle sizes
around an average value of 65 nm. These nanocrystals were prepared by chemical
reduction, precipitation, and subsequent annealing of the phase Si,Ge,O,, and the