

13.3. MOLECULAR AND SUPRAMOLECULAR SWITCHES
349
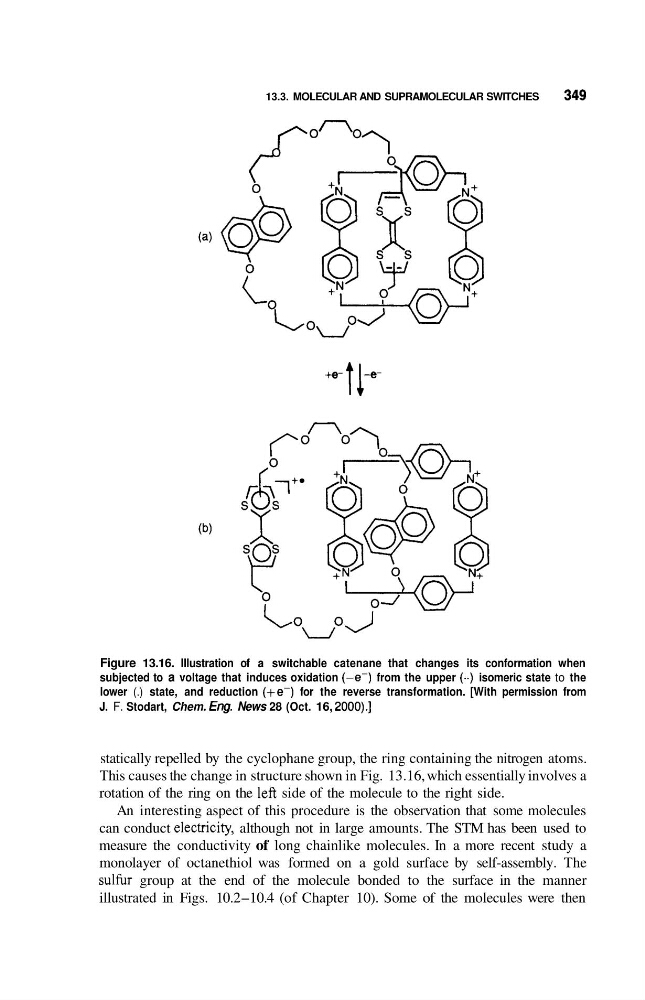
Figure 13.16. Illustration of a switchable catenane that changes its conformation when
subjected to a voltage that induces oxidation (-e-) from the upper (-) isomeric state to the
lower (.) state, and reduction (+e-) for the reverse transformation. [With permission from
J. F. Stodart, Chem. fng. News 28 (Oct. 16, 2000).]
statically repelled by the cyclophane group, the ring containing the nitrogen atoms.
This causes the change in structure shown in Fig. 13.16, which essentially involves a
rotation of the ring on the left side of the molecule to the right side.
An interesting aspect of this procedure is the observation that some molecules
can conduct electricity, although not in large amounts. The STM has been used to
measure the conductivity of long chainlike molecules. In a more recent study a
monolayer of octanethiol was formed on a gold surface by self-assembly. The
s u l k group at the end of the molecule bonded to the surface in the manner
illustrated in Figs. 10.2-10.4 (of Chapter 10). Some of the molecules were then
349
Figure 13.16. Illustration of a switchable catenane that changes its conformation when
subjected to a voltage that induces oxidation (-e-) from the upper (-) isomeric state to the
lower (.) state, and reduction (+e-) for the reverse transformation. [With permission from
J. F. Stodart, Chem. fng. News 28 (Oct. 16, 2000).]
statically repelled by the cyclophane group, the ring containing the nitrogen atoms.
This causes the change in structure shown in Fig. 13.16, which essentially involves a
rotation of the ring on the left side of the molecule to the right side.
An interesting aspect of this procedure is the observation that some molecules
can conduct electricity, although not in large amounts. The STM has been used to
measure the conductivity of long chainlike molecules. In a more recent study a
monolayer of octanethiol was formed on a gold surface by self-assembly. The
s u l k group at the end of the molecule bonded to the surface in the manner
illustrated in Figs. 10.2-10.4 (of Chapter 10). Some of the molecules were then