

9.3. SIZE AND DIMENSIONALITY EFFECTS
235
and at the temperature of absolute zero all the conduction electrons are equally
spread out inside a sphere of radius kF, and of volume 4nk:/3 in k space, as was
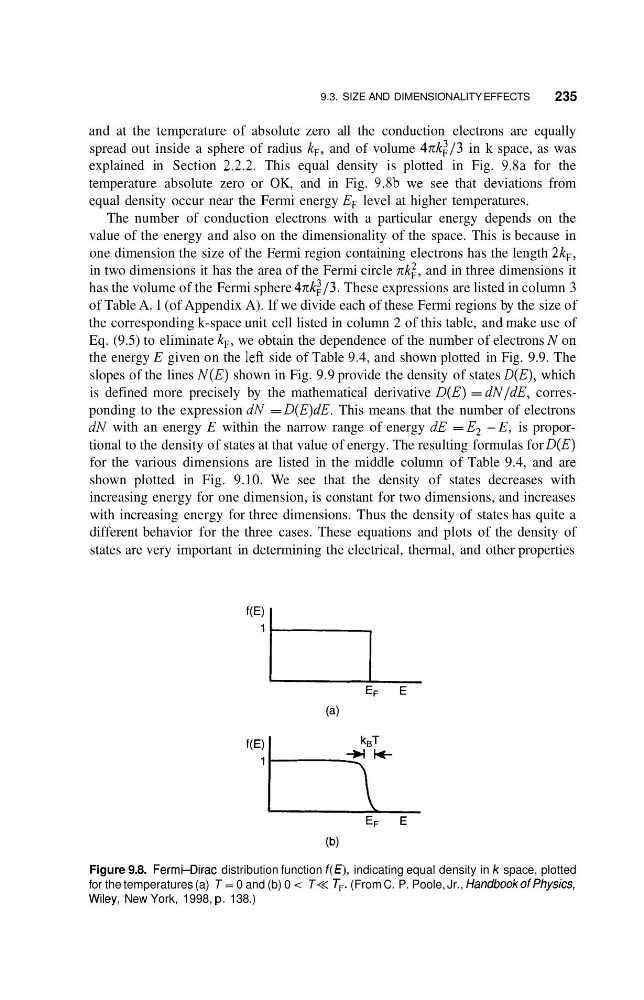
explained in Section 2.2.2. This equal density is plotted in Fig. 9.8a for the
temperature absolute zero or OK, and in Fig. 9.8b we see that deviations from
equal density occur near the Fermi energy EF level at higher temperatures.
The number of conduction electrons with a particular energy depends on the
value of the energy and also on the dimensionality of the space. This is because in
one dimension the size of the Fermi region containing electrons has the length 2kF,
in two dimensions it has the area of the Fermi circle nk:, and in three dimensions it
has the volume of the Fermi sphere 4nk:/3. These expressions are listed in column 3
of Table A. 1 (of Appendix A). If we divide each of these Fermi regions by the size of
the corresponding k-space unit cell listed in column 2 of this table, and make use of
Eq. (9.5) to eliminate kF, we obtain the dependence of the number of electrons N on
the energy E given on the left side of Table 9.4, and shown plotted in Fig. 9.9. The
slopes of the lines N ( E ) shown in Fig. 9.9 provide the density of states D(E), which
is defined more precisely by the mathematical derivative D(E) = dN/dE, corresponding to the expression dN = D(E)dE. This means that the number of electrons
dN with an energy E within the narrow range of energy dE = E2 - E, is proportional to the density of states at that value of energy. The resulting formulas for D(E)
for the various dimensions are listed in the middle column of Table 9.4, and are
shown plotted in Fig. 9.10. We see that the density of states decreases with
increasing energy for one dimension, is constant for two dimensions, and increases
with increasing energy for three dimensions. Thus the density of states has quite a
different behavior for the three cases. These equations and plots of the density of
states are very important in determining the electrical, thermal, and other properties
Figure 9.8. FermCDirac distribution function f(E), indicating equal density in k space, plotted
for the temperatures (a) T = 0 and (b) 0 < T << TF. (From C. P. Poole, Jr., HandbookofPhysics,
Wiley, New York, 1998, p. 138.)
235
and at the temperature of absolute zero all the conduction electrons are equally
spread out inside a sphere of radius kF, and of volume 4nk:/3 in k space, as was
explained in Section 2.2.2. This equal density is plotted in Fig. 9.8a for the
temperature absolute zero or OK, and in Fig. 9.8b we see that deviations from
equal density occur near the Fermi energy EF level at higher temperatures.
The number of conduction electrons with a particular energy depends on the
value of the energy and also on the dimensionality of the space. This is because in
one dimension the size of the Fermi region containing electrons has the length 2kF,
in two dimensions it has the area of the Fermi circle nk:, and in three dimensions it
has the volume of the Fermi sphere 4nk:/3. These expressions are listed in column 3
of Table A. 1 (of Appendix A). If we divide each of these Fermi regions by the size of
the corresponding k-space unit cell listed in column 2 of this table, and make use of
Eq. (9.5) to eliminate kF, we obtain the dependence of the number of electrons N on
the energy E given on the left side of Table 9.4, and shown plotted in Fig. 9.9. The
slopes of the lines N ( E ) shown in Fig. 9.9 provide the density of states D(E), which
is defined more precisely by the mathematical derivative D(E) = dN/dE, corresponding to the expression dN = D(E)dE. This means that the number of electrons
dN with an energy E within the narrow range of energy dE = E2 - E, is proportional to the density of states at that value of energy. The resulting formulas for D(E)
for the various dimensions are listed in the middle column of Table 9.4, and are
shown plotted in Fig. 9.10. We see that the density of states decreases with
increasing energy for one dimension, is constant for two dimensions, and increases
with increasing energy for three dimensions. Thus the density of states has quite a
different behavior for the three cases. These equations and plots of the density of
states are very important in determining the electrical, thermal, and other properties
Figure 9.8. FermCDirac distribution function f(E), indicating equal density in k space, plotted
for the temperatures (a) T = 0 and (b) 0 < T << TF. (From C. P. Poole, Jr., HandbookofPhysics,
Wiley, New York, 1998, p. 138.)