

216
OPTICAL AND VIBRATIONAL SPECTROSCOPY
Wavelength (nrn)
600 500
400
300
' A '
I
1
2.0
2.4 2.8 3.2
3.6
4.0
4.4
Energy (eV)
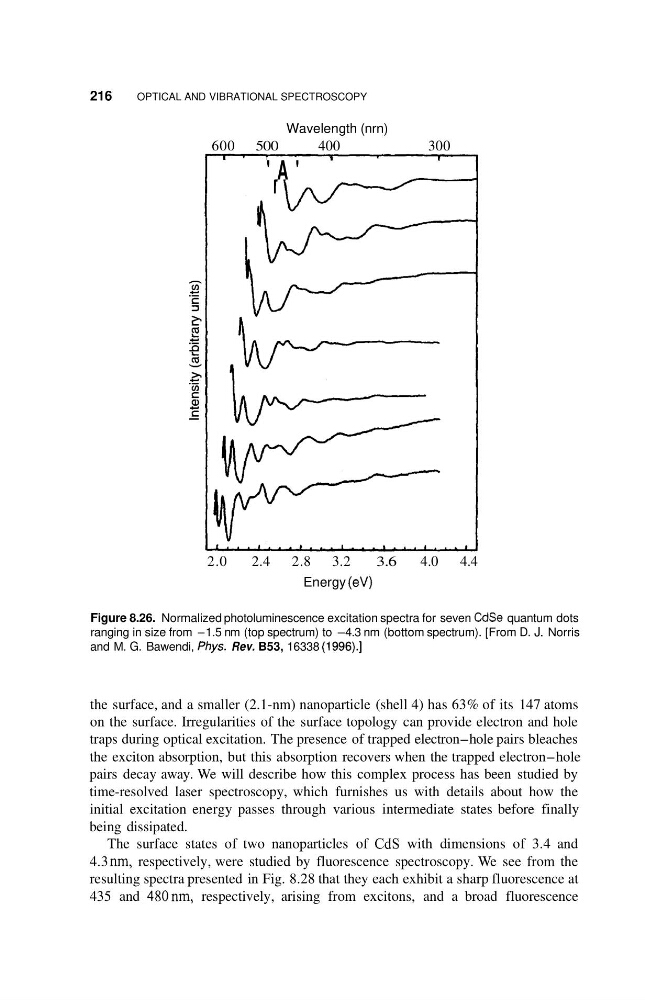
Figure 8.26. Normalized photoluminescence excitation spectra for seven CdSe quantum dots
ranging in size from -1.5 nm (top spectrum) to -4.3 nm (bottom spectrum). [From D. J. Norris
and M. G. Bawendi, Phys. Rev. B53, 16338 (1996).]
the surface, and a smaller (2.1-nm) nanoparticle (shell 4) has 63% of its 147 atoms
on the surface. Irregularities of the surface topology can provide electron and hole
traps during optical excitation. The presence of trapped electron-hole pairs bleaches
the exciton absorption, but this absorption recovers when the trapped electron-hole
pairs decay away. We will describe how this complex process has been studied by
time-resolved laser spectroscopy, which furnishes us with details about how the
initial excitation energy passes through various intermediate states before finally
being dissipated.
The surface states of two nanoparticles of CdS with dimensions of 3.4 and
4.3 nm, respectively, were studied by fluorescence spectroscopy. We see from the
resulting spectra presented in Fig. 8.28 that they each exhibit a sharp fluorescence at
435 and 480nm, respectively, arising from excitons, and a broad fluorescence
OPTICAL AND VIBRATIONAL SPECTROSCOPY
Wavelength (nrn)
600 500
400
300
' A '
I
1
2.0
2.4 2.8 3.2
3.6
4.0
4.4
Energy (eV)
Figure 8.26. Normalized photoluminescence excitation spectra for seven CdSe quantum dots
ranging in size from -1.5 nm (top spectrum) to -4.3 nm (bottom spectrum). [From D. J. Norris
and M. G. Bawendi, Phys. Rev. B53, 16338 (1996).]
the surface, and a smaller (2.1-nm) nanoparticle (shell 4) has 63% of its 147 atoms
on the surface. Irregularities of the surface topology can provide electron and hole
traps during optical excitation. The presence of trapped electron-hole pairs bleaches
the exciton absorption, but this absorption recovers when the trapped electron-hole
pairs decay away. We will describe how this complex process has been studied by
time-resolved laser spectroscopy, which furnishes us with details about how the
initial excitation energy passes through various intermediate states before finally
being dissipated.
The surface states of two nanoparticles of CdS with dimensions of 3.4 and
4.3 nm, respectively, were studied by fluorescence spectroscopy. We see from the
resulting spectra presented in Fig. 8.28 that they each exhibit a sharp fluorescence at
435 and 480nm, respectively, arising from excitons, and a broad fluorescence