

8.3. LUMINESCENCE
215
-
m
z
In
C
a,
C
?
v
-
.c
-
....
. ................ ....
.. . .
..
.. . :
.......' Emission at 2.1 75 eV
1.8
2
2.2
2.4
2.6
2.8
3
3.2
Photon Energy (eV)
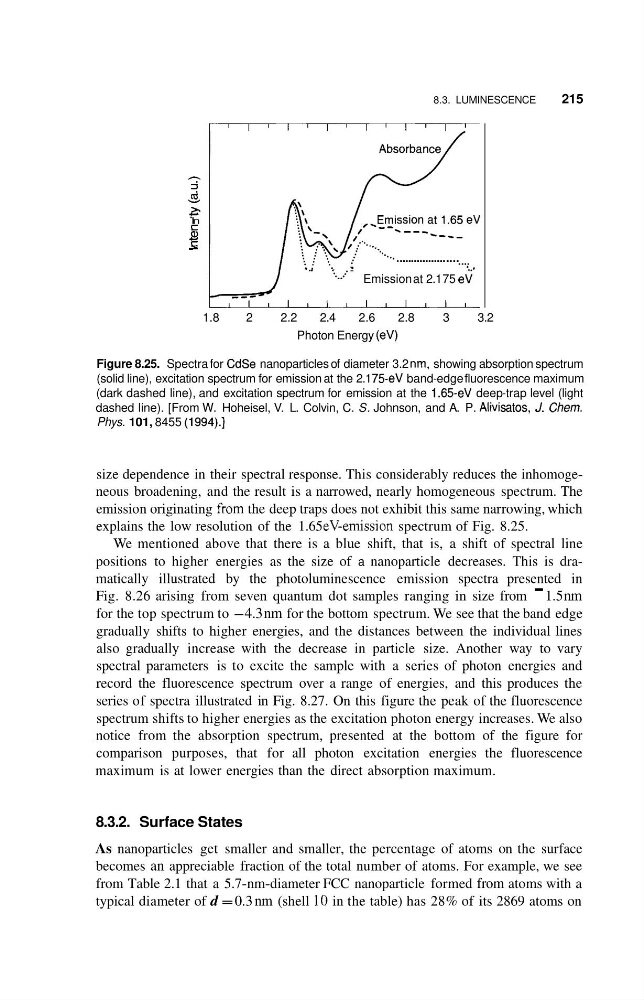
Figure 8.25. Spectra for CdSe nanoparticles of diameter 3.2 nm, showing absorption spectrum
(solid line), excitation spectrum for emission at the 2.1 75-eV band-edge fluorescence maximum
(dark dashed line), and excitation spectrum for emission at the 1.65-eV deep-trap level (light
dashed line). [From W. Hoheisel, V. L. Colvin, C. S. Johnson, and A. P. Alivisatos, J. Chern.
Phys. 101, 8455 (1994).]
size dependence in their spectral response. This considerably reduces the inhomogeneous broadening, and the result is a narrowed, nearly homogeneous spectrum. The
emission originating from the deep traps does not exhibit this same narrowing, which
explains the low resolution of the 1.65 eV-emission spectrum of Fig. 8.25.
We mentioned above that there is a blue shift, that is, a shift of spectral line
positions to higher energies as the size of a nanoparticle decreases. This is dramatically illustrated by the photoluminescence emission spectra presented in
Fig. 8.26 arising from seven quantum dot samples ranging in size from - 1.5 nm
for the top spectrum to -4.3 nm for the bottom spectrum. We see that the band edge
gradually shifts to higher energies, and the distances between the individual lines
also gradually increase with the decrease in particle size. Another way to vary
spectral parameters is to excite the sample with a series of photon energies and
record the fluorescence spectrum over a range of energies, and this produces the
series of spectra illustrated in Fig. 8.27. On this figure the peak of the fluorescence
spectrum shifts to higher energies as the excitation photon energy increases. We also
notice from the absorption spectrum, presented at the bottom of the figure for
comparison purposes, that for all photon excitation energies the fluorescence
maximum is at lower energies than the direct absorption maximum.
8.3.2. Surface States
As nanoparticles get smaller and smaller, the percentage of atoms on the surface
becomes an appreciable fraction of the total number of atoms. For example, we see
from Table 2.1 that a 5.7-nm-diameter FCC nanoparticle formed from atoms with a
typical diameter of d = 0.3 nm (shell 10 in the table) has 28% of its 2869 atoms on
215
-
m
z
In
C
a,
C
?
v
-
.c
-
....
. ................ ....
.. . .
..
.. . :
.......' Emission at 2.1 75 eV
1.8
2
2.2
2.4
2.6
2.8
3
3.2
Photon Energy (eV)
Figure 8.25. Spectra for CdSe nanoparticles of diameter 3.2 nm, showing absorption spectrum
(solid line), excitation spectrum for emission at the 2.1 75-eV band-edge fluorescence maximum
(dark dashed line), and excitation spectrum for emission at the 1.65-eV deep-trap level (light
dashed line). [From W. Hoheisel, V. L. Colvin, C. S. Johnson, and A. P. Alivisatos, J. Chern.
Phys. 101, 8455 (1994).]
size dependence in their spectral response. This considerably reduces the inhomogeneous broadening, and the result is a narrowed, nearly homogeneous spectrum. The
emission originating from the deep traps does not exhibit this same narrowing, which
explains the low resolution of the 1.65 eV-emission spectrum of Fig. 8.25.
We mentioned above that there is a blue shift, that is, a shift of spectral line
positions to higher energies as the size of a nanoparticle decreases. This is dramatically illustrated by the photoluminescence emission spectra presented in
Fig. 8.26 arising from seven quantum dot samples ranging in size from - 1.5 nm
for the top spectrum to -4.3 nm for the bottom spectrum. We see that the band edge
gradually shifts to higher energies, and the distances between the individual lines
also gradually increase with the decrease in particle size. Another way to vary
spectral parameters is to excite the sample with a series of photon energies and
record the fluorescence spectrum over a range of energies, and this produces the
series of spectra illustrated in Fig. 8.27. On this figure the peak of the fluorescence
spectrum shifts to higher energies as the excitation photon energy increases. We also
notice from the absorption spectrum, presented at the bottom of the figure for
comparison purposes, that for all photon excitation energies the fluorescence
maximum is at lower energies than the direct absorption maximum.
8.3.2. Surface States
As nanoparticles get smaller and smaller, the percentage of atoms on the surface
becomes an appreciable fraction of the total number of atoms. For example, we see
from Table 2.1 that a 5.7-nm-diameter FCC nanoparticle formed from atoms with a
typical diameter of d = 0.3 nm (shell 10 in the table) has 28% of its 2869 atoms on