

214
OPTICAL AND VIBRATIONAL SPECTROSCOPY
Wavelength (nm)
650 600 550
500
450
400
J 1 ~
I
I
I
~
I
I
I
~
I
I
I
~
L I I I I I I I I I I I I l l 1 I
2.0
2.2
2.4
2.6
2.8
3.0
3.2 3.4
Energy (eV)
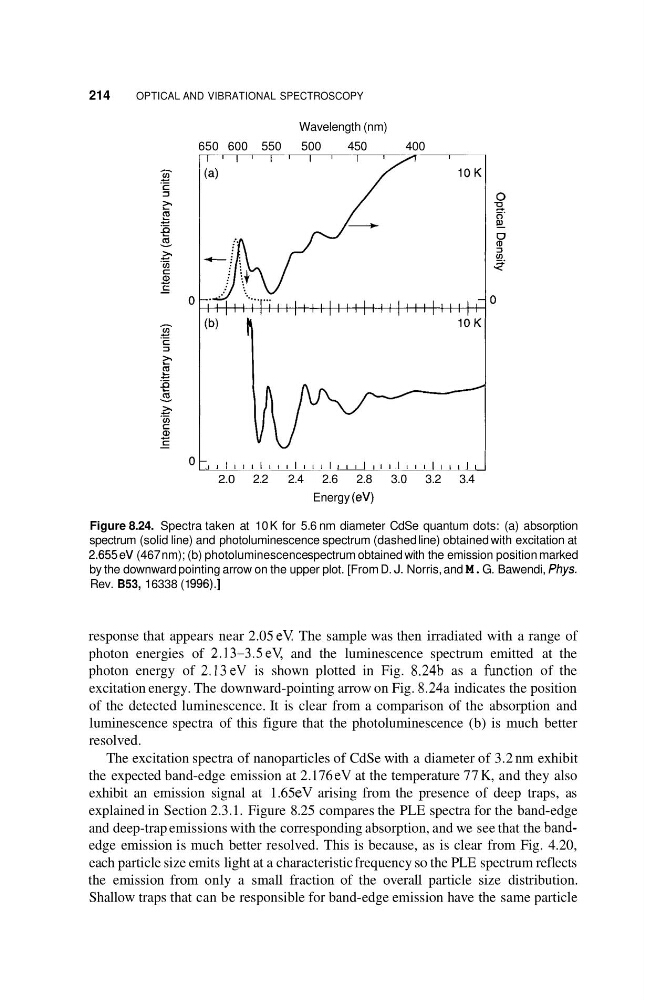
Figure 8.24. Spectra taken at 10 K for 5.6 nm diameter CdSe quantum dots: (a) absorption
spectrum (solid line) and photoluminescence spectrum (dashed line) obtained with excitation at
2.655eV (467 nm); (b) photoluminescence spectrum obtained with the emission position marked
by the downward pointing arrow on the upper plot. [From D. J. Norris, and M. G. Bawendi, Phys.
Rev. B53, 16338 (1 996).]
response that appears near 2.05 eV. The sample was then irradiated with a range of
photon energies of 2.13-3.5eY and the luminescence spectrum emitted at the
photon energy of 2.13eV is shown plotted in Fig. 8.24b as a h c t i o n of the
excitation energy. The downward-pointing arrow on Fig. 8.24a indicates the position
of the detected luminescence. It is clear from a comparison of the absorption and
luminescence spectra of this figure that the photoluminescence (b) is much better
resolved.
The excitation spectra of nanoparticles of CdSe with a diameter of 3.2 nm exhibit
the expected band-edge emission at 2.176 eV at the temperature 77 K, and they also
exhibit an emission signal at 1.65 eV arising from the presence of deep traps, as
explained in Section 2.3.1. Figure 8.25 compares the PLE spectra for the band-edge
and deep-trap emissions with the corresponding absorption, and we see that the bandedge emission is much better resolved. This is because, as is clear from Fig. 4.20,
each particle size emits light at a characteristic frequency so the PLE spectrum reflects
the emission from only a small fraction of the overall particle size distribution.
Shallow traps that can be responsible for band-edge emission have the same particle
OPTICAL AND VIBRATIONAL SPECTROSCOPY
Wavelength (nm)
650 600 550
500
450
400
J 1 ~
I
I
I
~
I
I
I
~
I
I
I
~
L I I I I I I I I I I I I l l 1 I
2.0
2.2
2.4
2.6
2.8
3.0
3.2 3.4
Energy (eV)
Figure 8.24. Spectra taken at 10 K for 5.6 nm diameter CdSe quantum dots: (a) absorption
spectrum (solid line) and photoluminescence spectrum (dashed line) obtained with excitation at
2.655eV (467 nm); (b) photoluminescence spectrum obtained with the emission position marked
by the downward pointing arrow on the upper plot. [From D. J. Norris, and M. G. Bawendi, Phys.
Rev. B53, 16338 (1 996).]
response that appears near 2.05 eV. The sample was then irradiated with a range of
photon energies of 2.13-3.5eY and the luminescence spectrum emitted at the
photon energy of 2.13eV is shown plotted in Fig. 8.24b as a h c t i o n of the
excitation energy. The downward-pointing arrow on Fig. 8.24a indicates the position
of the detected luminescence. It is clear from a comparison of the absorption and
luminescence spectra of this figure that the photoluminescence (b) is much better
resolved.
The excitation spectra of nanoparticles of CdSe with a diameter of 3.2 nm exhibit
the expected band-edge emission at 2.176 eV at the temperature 77 K, and they also
exhibit an emission signal at 1.65 eV arising from the presence of deep traps, as
explained in Section 2.3.1. Figure 8.25 compares the PLE spectra for the band-edge
and deep-trap emissions with the corresponding absorption, and we see that the bandedge emission is much better resolved. This is because, as is clear from Fig. 4.20,
each particle size emits light at a characteristic frequency so the PLE spectrum reflects
the emission from only a small fraction of the overall particle size distribution.
Shallow traps that can be responsible for band-edge emission have the same particle