

8.3. LUMINESCENCE
213
E (cm-’ )
i
20 c
I
1 ID
0
4x10⁷
8 107 (,,-I)
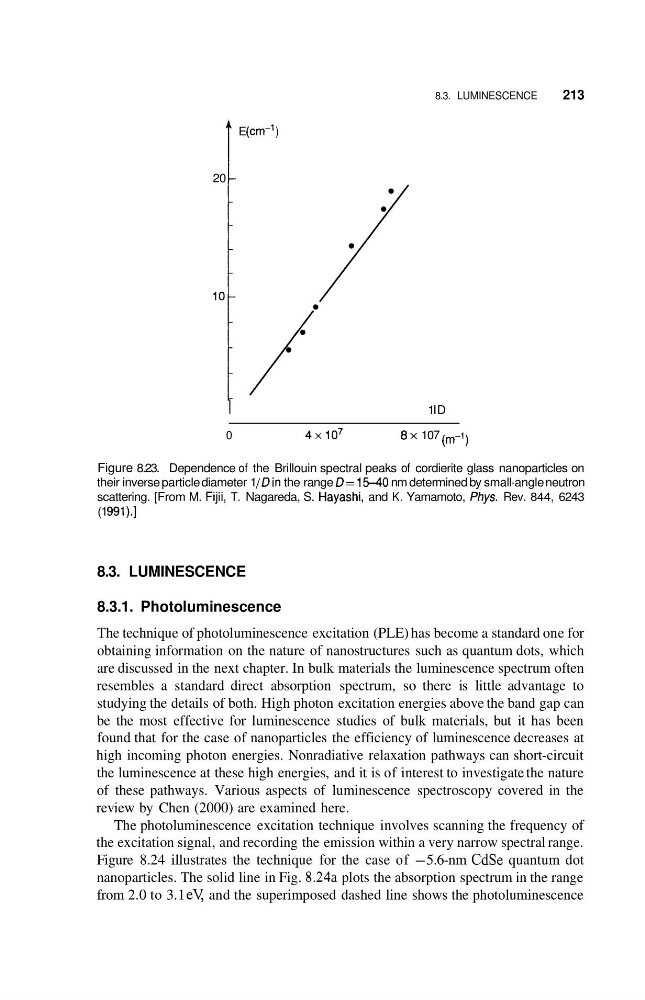
Figure 8.23. Dependence of the Brillouin spectral peaks of cordierite glass nanoparticles on
their inverse particle diameter 1 /Din the range D= 1 5 4 0 nm determined by small-angle neutron
scattering. [From M. Fiji, T. Nagareda, S. Hayashi, and K. Yamamoto, Phys. Rev. 844, 6243
(1 991).]
8.3. LUMINESCENCE
8.3.1. Photoluminescence
The technique of photoluminescence excitation (PLE) has become a standard one for
obtaining information on the nature of nanostructures such as quantum dots, which
are discussed in the next chapter. In bulk materials the luminescence spectrum often
resembles a standard direct absorption spectrum, so there is little advantage to
studying the details of both. High photon excitation energies above the band gap can
be the most effective for luminescence studies of bulk materials, but it has been
found that for the case of nanoparticles the efficiency of luminescence decreases at
high incoming photon energies. Nonradiative relaxation pathways can short-circuit
the luminescence at these high energies, and it is of interest to investigate the nature
of these pathways. Various aspects of luminescence spectroscopy covered in the
review by Chen (2000) are examined here.
The photoluminescence excitation technique involves scanning the frequency of
the excitation signal, and recording the emission within a very narrow spectral range.
Figure 8.24 illustrates the technique for the case of -5.6-nm CdSe quantum dot
nanoparticles. The solid line in Fig. 8.24a plots the absorption spectrum in the range
from 2.0 to 3.1 e y and the superimposed dashed line shows the photoluminescence
213
E (cm-’ )
i
20 c
I
1 ID
0
4x10⁷
8 107 (,,-I)
Figure 8.23. Dependence of the Brillouin spectral peaks of cordierite glass nanoparticles on
their inverse particle diameter 1 /Din the range D= 1 5 4 0 nm determined by small-angle neutron
scattering. [From M. Fiji, T. Nagareda, S. Hayashi, and K. Yamamoto, Phys. Rev. 844, 6243
(1 991).]
8.3. LUMINESCENCE
8.3.1. Photoluminescence
The technique of photoluminescence excitation (PLE) has become a standard one for
obtaining information on the nature of nanostructures such as quantum dots, which
are discussed in the next chapter. In bulk materials the luminescence spectrum often
resembles a standard direct absorption spectrum, so there is little advantage to
studying the details of both. High photon excitation energies above the band gap can
be the most effective for luminescence studies of bulk materials, but it has been
found that for the case of nanoparticles the efficiency of luminescence decreases at
high incoming photon energies. Nonradiative relaxation pathways can short-circuit
the luminescence at these high energies, and it is of interest to investigate the nature
of these pathways. Various aspects of luminescence spectroscopy covered in the
review by Chen (2000) are examined here.
The photoluminescence excitation technique involves scanning the frequency of
the excitation signal, and recording the emission within a very narrow spectral range.
Figure 8.24 illustrates the technique for the case of -5.6-nm CdSe quantum dot
nanoparticles. The solid line in Fig. 8.24a plots the absorption spectrum in the range
from 2.0 to 3.1 e y and the superimposed dashed line shows the photoluminescence