

212
OPTICAL AND VIBRATIONAL SPECTROSCOPY
plotted below the experimental one. The peaks of the experimental spectrum are
much broader due to the roughness and structural irregularities of the surface. The
theoretical fit provided values for the shear modulus p E 4.0 GPa, the bulk modulus
-3.7 GPa, and Poisson's ratio El .O, consistent with the known value of the graphite
elastic constant C44.
Acoustic phonons of nanoparticles exhibit Brillouin scattering that depends on
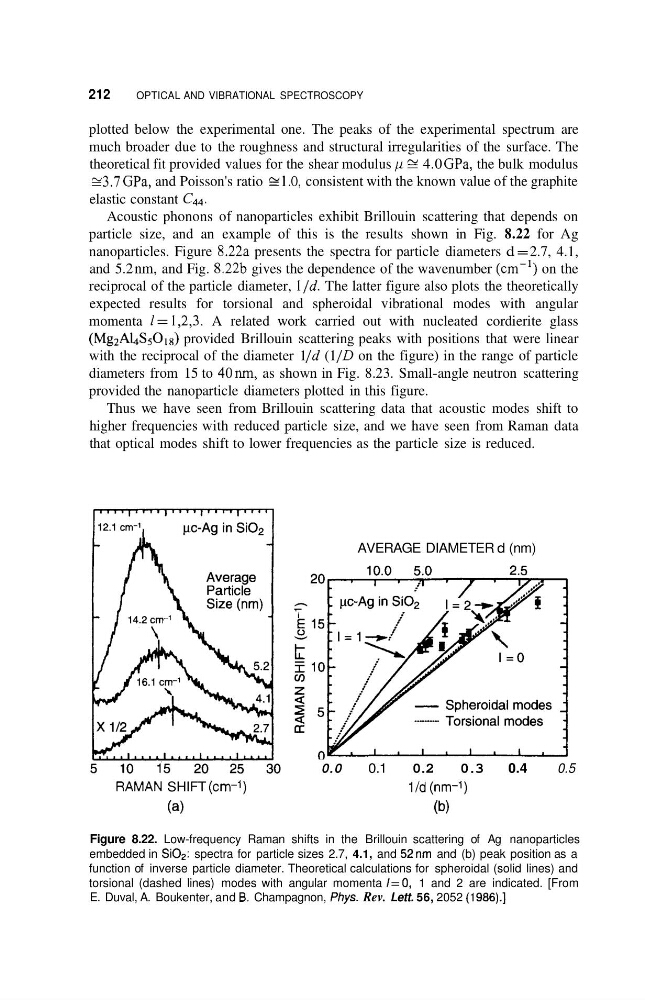
particle size, and an example of this is the results shown in Fig. 8.22 for Ag
nanoparticles. Figure 8.22a presents the spectra for particle diameters d = 2.7, 4.1,
and 5.2 nm, and Fig. 8.22b gives the dependence of the wavenumber (cm-') on the
reciprocal of the particle diameter, l/d. The latter figure also plots the theoretically
expected results for torsional and spheroidal vibrational modes with angular
momenta 1= 1,2,3. A related work carried out with nucleated cordierite glass
(Mg2AL&OI8) provided Brillouin scattering peaks with positions that were linear
with the reciprocal of the diameter 1 /d (1 /D on the figure) in the range of particle
diameters from 15 to 40nm, as shown in Fig. 8.23. Small-angle neutron scattering
provided the nanoparticle diameters plotted in this figure.
Thus we have seen from Brillouin scattering data that acoustic modes shift to
higher frequencies with reduced particle size, and we have seen from Raman data
that optical modes shift to lower frequencies as the particle size is reduced.
AVERAGE DIAMETER d (nm)
RAMAN SHIFT (cm-1)
(4
Figure 8.22. Low-frequency Raman
0.0
0.1
0.2
0.3
0.4
0.5
l/d (nm-1)
(b)
shifts in the Brillouin scattering of Ag nanoparticles
embedded in Si02: spectra for particle sizes 2.7, 4.1, and 52nm and (b) peak position as a
function of inverse particle diameter. Theoretical calculations for spheroidal (solid lines) and
torsional (dashed lines) modes with angular momenta I=O, 1 and 2 are indicated. [From
E. Duval, A. Boukenter, and 6. Champagnon, Phys. Rev. Lett. 56, 2052 (1986).]
OPTICAL AND VIBRATIONAL SPECTROSCOPY
plotted below the experimental one. The peaks of the experimental spectrum are
much broader due to the roughness and structural irregularities of the surface. The
theoretical fit provided values for the shear modulus p E 4.0 GPa, the bulk modulus
-3.7 GPa, and Poisson's ratio El .O, consistent with the known value of the graphite
elastic constant C44.
Acoustic phonons of nanoparticles exhibit Brillouin scattering that depends on
particle size, and an example of this is the results shown in Fig. 8.22 for Ag
nanoparticles. Figure 8.22a presents the spectra for particle diameters d = 2.7, 4.1,
and 5.2 nm, and Fig. 8.22b gives the dependence of the wavenumber (cm-') on the
reciprocal of the particle diameter, l/d. The latter figure also plots the theoretically
expected results for torsional and spheroidal vibrational modes with angular
momenta 1= 1,2,3. A related work carried out with nucleated cordierite glass
(Mg2AL&OI8) provided Brillouin scattering peaks with positions that were linear
with the reciprocal of the diameter 1 /d (1 /D on the figure) in the range of particle
diameters from 15 to 40nm, as shown in Fig. 8.23. Small-angle neutron scattering
provided the nanoparticle diameters plotted in this figure.
Thus we have seen from Brillouin scattering data that acoustic modes shift to
higher frequencies with reduced particle size, and we have seen from Raman data
that optical modes shift to lower frequencies as the particle size is reduced.
AVERAGE DIAMETER d (nm)
RAMAN SHIFT (cm-1)
(4
Figure 8.22. Low-frequency Raman
0.0
0.1
0.2
0.3
0.4
0.5
l/d (nm-1)
(b)
shifts in the Brillouin scattering of Ag nanoparticles
embedded in Si02: spectra for particle sizes 2.7, 4.1, and 52nm and (b) peak position as a
function of inverse particle diameter. Theoretical calculations for spheroidal (solid lines) and
torsional (dashed lines) modes with angular momenta I=O, 1 and 2 are indicated. [From
E. Duval, A. Boukenter, and 6. Champagnon, Phys. Rev. Lett. 56, 2052 (1986).]