

8.2. INFRARED FREQUENCY RANGE
209
I T Glassy Carbon
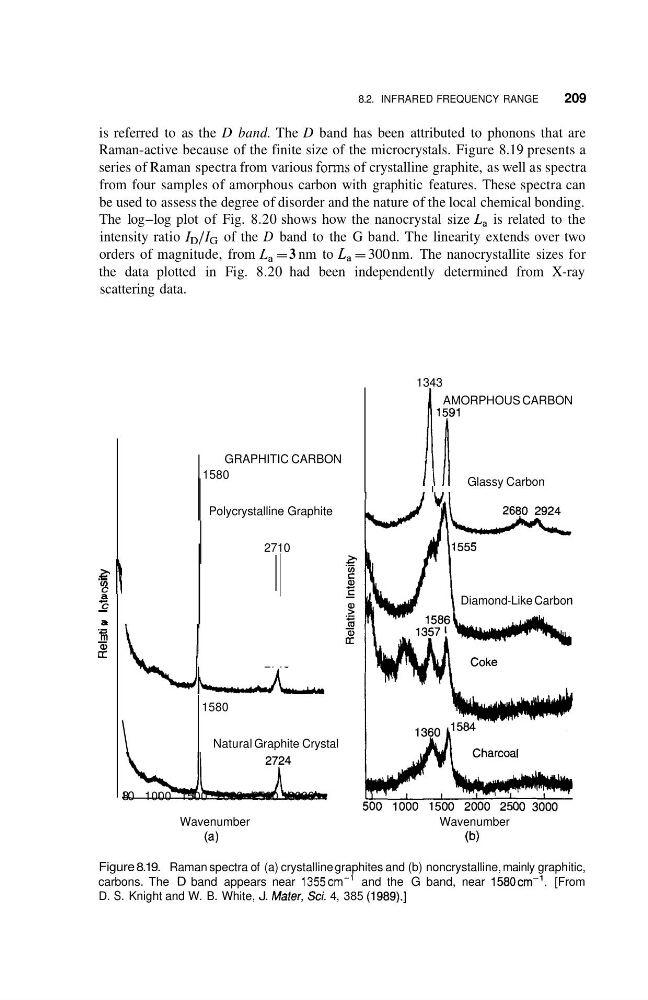
is referred to as the D band. The D band has been attributed to phonons that are
Raman-active because of the finite size of the microcrystals. Figure 8.19 presents a
series of Raman spectra from various forms of crystalline graphite, as well as spectra
from four samples of amorphous carbon with graphitic features. These spectra can
be used to assess the degree of disorder and the nature of the local chemical bonding.
The log-log plot of Fig. 8.20 shows how the nanocrystal size La is related to the
intensity ratio ID/IG of the D band to the G band. The linearity extends over two
orders of magnitude, from La = 3 nm to La = 300 nm. The nanocrystallite sizes for
the data plotted in Fig. 8.20 had been independently determined from X-ray
scattering data.
271 0
2 .
ln
C
a
C
a >
m
c
.c
-
._
I
-
2
\
GRAPHITIC CARBON
1580
Polycrystalline Graphite
1580
Natural Graphite Crystal
u
30 1000 1500 2000 2500 3000
Wavenumber
(a)
1343
1 AMORPHOUS CARBON
Diamond-Like Carbon
Wavenumber
(b)
Figure 8.19. Raman spectra of (a) crystalline graphites and (b) noncrystalline, mainly graphitic,
carbons. The D band appears near 1355cm-’ and the G band, near 1580cm-’. [From
D. S. Knight and W. B. White, J. Mater, Sci. 4, 385 (1989).]
209
I T Glassy Carbon
is referred to as the D band. The D band has been attributed to phonons that are
Raman-active because of the finite size of the microcrystals. Figure 8.19 presents a
series of Raman spectra from various forms of crystalline graphite, as well as spectra
from four samples of amorphous carbon with graphitic features. These spectra can
be used to assess the degree of disorder and the nature of the local chemical bonding.
The log-log plot of Fig. 8.20 shows how the nanocrystal size La is related to the
intensity ratio ID/IG of the D band to the G band. The linearity extends over two
orders of magnitude, from La = 3 nm to La = 300 nm. The nanocrystallite sizes for
the data plotted in Fig. 8.20 had been independently determined from X-ray
scattering data.
271 0
2 .
ln
C
a
C
a >
m
c
.c
-
._
I
-
2
\
GRAPHITIC CARBON
1580
Polycrystalline Graphite
1580
Natural Graphite Crystal
u
30 1000 1500 2000 2500 3000
Wavenumber
(a)
1343
1 AMORPHOUS CARBON
Diamond-Like Carbon
Wavenumber
(b)
Figure 8.19. Raman spectra of (a) crystalline graphites and (b) noncrystalline, mainly graphitic,
carbons. The D band appears near 1355cm-’ and the G band, near 1580cm-’. [From
D. S. Knight and W. B. White, J. Mater, Sci. 4, 385 (1989).]