

208
OPTICAL AND VIBRATIONAL SPECTROSCOPY
500
800
1100 1400 1700 2000
RAMAN SHIFT (cm-')
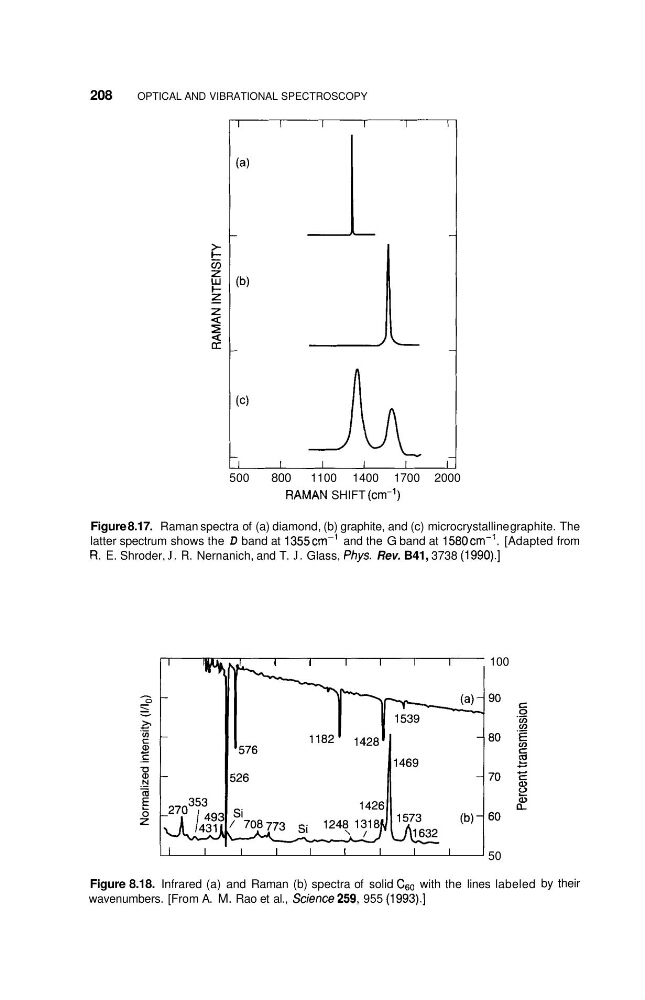
Figure 8.17. Raman spectra of (a) diamond, (b) graphite, and (c) microcrystalline graphite. The
latter spectrum shows the D band at 1355cm-' and the G band at 1580cm-'. [Adapted from
R. E. Shroder, J. R. Nernanich, and T. J. Glass, Phys. Rev. B41, 3738 (1990).]
I
I
I
I
I
I
100
I 1
I
I
I
I
I
I
I
I
' 50
Figure 8.18. Infrared (a) and Raman (b) spectra of solid CG0 with the lines labeled
wavenumbers. [From A. M. Rao et al., Science259, 955 (1993).]
by their
OPTICAL AND VIBRATIONAL SPECTROSCOPY
500
800
1100 1400 1700 2000
RAMAN SHIFT (cm-')
Figure 8.17. Raman spectra of (a) diamond, (b) graphite, and (c) microcrystalline graphite. The
latter spectrum shows the D band at 1355cm-' and the G band at 1580cm-'. [Adapted from
R. E. Shroder, J. R. Nernanich, and T. J. Glass, Phys. Rev. B41, 3738 (1990).]
I
I
I
I
I
I
100
I 1
I
I
I
I
I
I
I
I
' 50
Figure 8.18. Infrared (a) and Raman (b) spectra of solid CG0 with the lines labeled
wavenumbers. [From A. M. Rao et al., Science259, 955 (1993).]
by their