

8.2. INFRARED FREQUENCY RANGE
207
520
51 8
-
r
I
v 6 516
a "
51 4
51 2
0
50
100
Crystallite size, a (A)
150
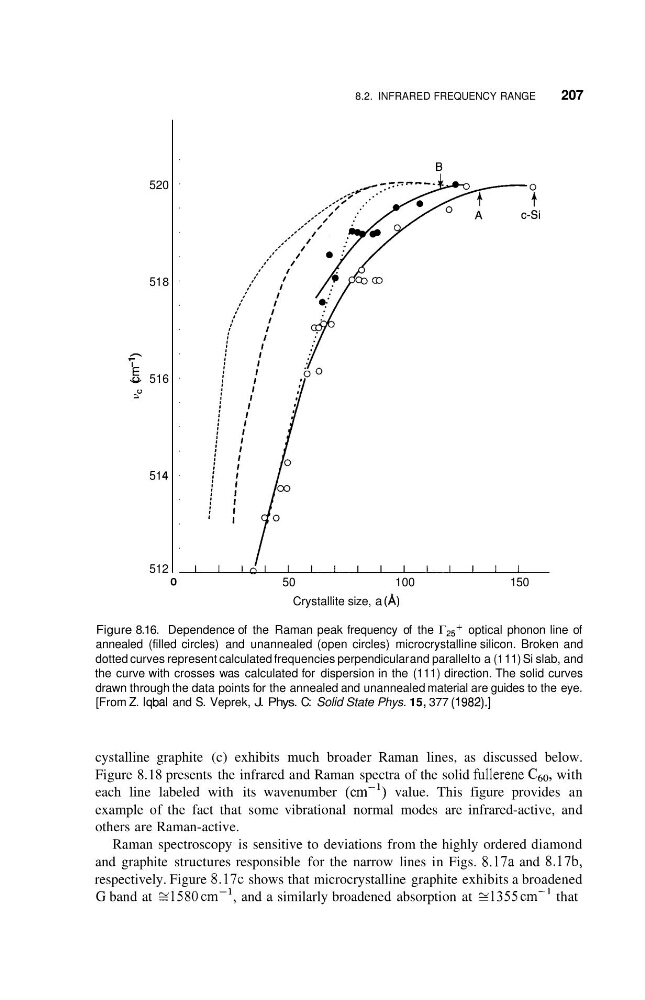
Figure 8.16. Dependence of the Raman peak frequency of the rP5+ optical phonon line of
annealed (filled circles) and unannealed (open circles) microcrystalline silicon. Broken and
dotted curves represent calculated frequencies perpendicular and parallel to a (1 11) Si slab, and
the curve with crosses was calculated for dispersion in the (111) direction. The solid curves
drawn through the data points for the annealed and unannealed material are guides to the eye.
[From Z. lqbal and S. Veprek, J. Phys. C: Solid State Phys. 15, 377 (1982).]
cystalline graphite (c) exhibits much broader Raman lines, as discussed below.
Figure 8.18 presents the infrared and Raman spectra of the solid fullerene C60, with
each line labeled with its wavenumber (cm-') value. This figure provides an
example of the fact that some vibrational normal modes are infrared-active, and
others are Raman-active.
Raman spectroscopy is sensitive to deviations from the highly ordered diamond
and graphite structures responsible for the narrow lines in Figs. 8.17a and 8.17b,
respectively. Figure 8 . 1 7 ~ shows that microcrystalline graphite exhibits a broadened
G band at 21580 cm-', and a similarly broadened absorption at "1355 cm-' that
207
520
51 8
-
r
I
v 6 516
a "
51 4
51 2
0
50
100
Crystallite size, a (A)
150
Figure 8.16. Dependence of the Raman peak frequency of the rP5+ optical phonon line of
annealed (filled circles) and unannealed (open circles) microcrystalline silicon. Broken and
dotted curves represent calculated frequencies perpendicular and parallel to a (1 11) Si slab, and
the curve with crosses was calculated for dispersion in the (111) direction. The solid curves
drawn through the data points for the annealed and unannealed material are guides to the eye.
[From Z. lqbal and S. Veprek, J. Phys. C: Solid State Phys. 15, 377 (1982).]
cystalline graphite (c) exhibits much broader Raman lines, as discussed below.
Figure 8.18 presents the infrared and Raman spectra of the solid fullerene C60, with
each line labeled with its wavenumber (cm-') value. This figure provides an
example of the fact that some vibrational normal modes are infrared-active, and
others are Raman-active.
Raman spectroscopy is sensitive to deviations from the highly ordered diamond
and graphite structures responsible for the narrow lines in Figs. 8.17a and 8.17b,
respectively. Figure 8 . 1 7 ~ shows that microcrystalline graphite exhibits a broadened
G band at 21580 cm-', and a similarly broadened absorption at "1355 cm-' that