

206
OPTICAL AND VIBRATIONAL SPECTROSCOPY
Ald
H
500
505
5 1 0
515
Wg 520
525
530
WAVENUMBERS
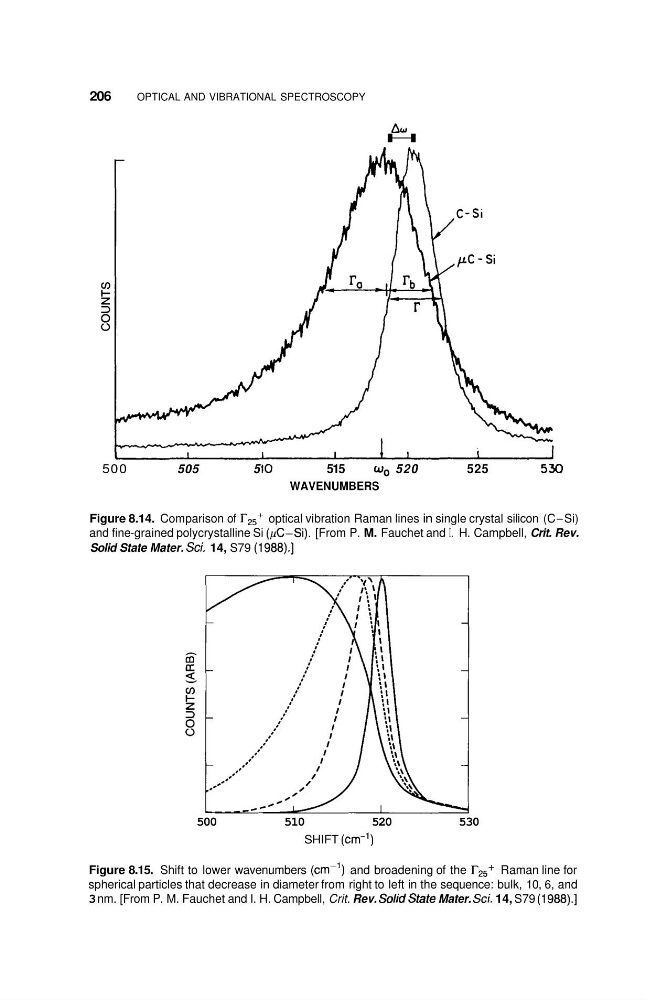
Figure 8.14. Comparison of r25+ optical vibration Raman lines in single crystal silicon (C-Si)
and fine-grained polycrystalline Si (pC-Si). [From P. M. Fauchet and I. H. Campbell, Crit. Rev.
Solid State Mater. Sci. 14, S79 (1988).]
500
510
520
530
SHIFT (cm-’)
Figure 8.15. Shift to lower wavenumbers (cm-’) and broadening of the r25+ Raman line for
spherical particles that decrease in diameter from right to left in the sequence: bulk, 10, 6, and
3 nm. [From P. M. Fauchet and I. H. Campbell, Crit. Rev. Solidstate Mater. Sci. 14, S79 (1988).]
OPTICAL AND VIBRATIONAL SPECTROSCOPY
Ald
H
500
505
5 1 0
515
Wg 520
525
530
WAVENUMBERS
Figure 8.14. Comparison of r25+ optical vibration Raman lines in single crystal silicon (C-Si)
and fine-grained polycrystalline Si (pC-Si). [From P. M. Fauchet and I. H. Campbell, Crit. Rev.
Solid State Mater. Sci. 14, S79 (1988).]
500
510
520
530
SHIFT (cm-’)
Figure 8.15. Shift to lower wavenumbers (cm-’) and broadening of the r25+ Raman line for
spherical particles that decrease in diameter from right to left in the sequence: bulk, 10, 6, and
3 nm. [From P. M. Fauchet and I. H. Campbell, Crit. Rev. Solidstate Mater. Sci. 14, S79 (1988).]