

8.2. INFRARED FREQUENCY RANGE
205
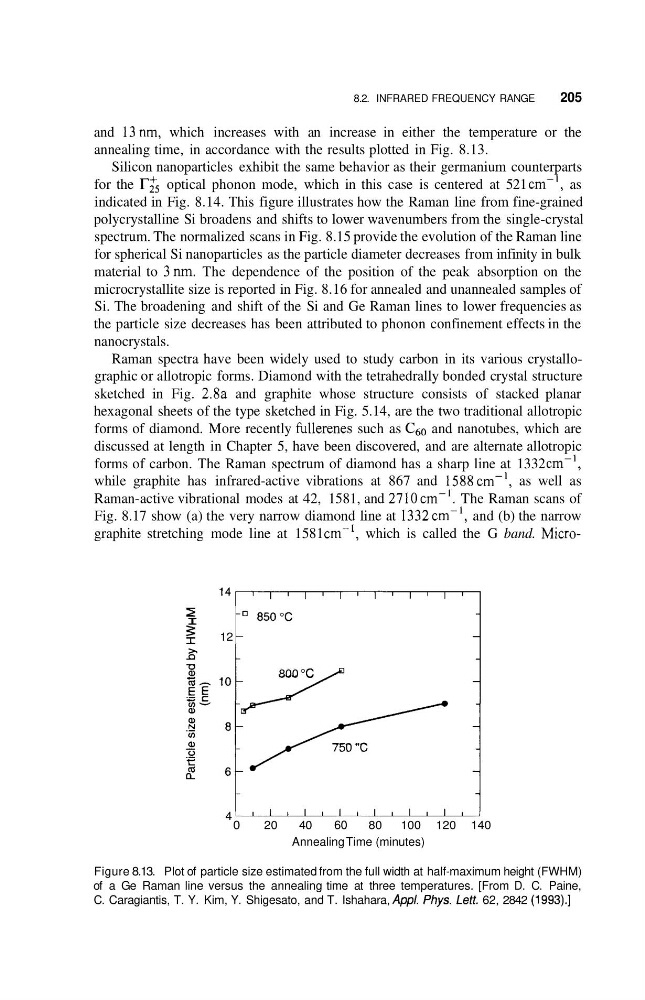
and 13nm, which increases with an increase in either the temperature or the
annealing time, in accordance with the results plotted in Fig. 8.13.
Silicon nanoparticles exhibit the same behavior as their germanium counterparts
for the r& optical phonon mode, which in this case is centered at 521 cm-', as
indicated in Fig. 8.14. This figure illustrates how the Raman line from fine-grained
polycrystalline Si broadens and shifts to lower wavenumbers from the single-crystal
spectrum. The normalized scans in Fig. 8.15 provide the evolution of the Raman line
for spherical Si nanoparticles as the particle diameter decreases from infinity in bulk
material to 3nm. The dependence of the position of the peak absorption on the
microcrystallite size is reported in Fig. 8.16 for annealed and unannealed samples of
Si. The broadening and shift of the Si and Ge Raman lines to lower frequencies as
the particle size decreases has been attributed to phonon confinement effects in the
nanocrystals.
Raman spectra have been widely used to study carbon in its various crystallographic or allotropic forms. Diamond with the tetrahedrally bonded crystal structure
sketched in Fig. 2.8a and graphite whose structure consists of stacked planar
hexagonal sheets of the type sketched in Fig. 5.14, are the two traditional allotropic
forms of diamond. More recently hllerenes such as C60 and nanotubes, which are
discussed at length in Chapter 5, have been discovered, and are alternate allotropic
forms of carbon. The Raman spectrum of diamond has a sharp line at 1332 cm-',
while graphite has infrared-active vibrations at 867 and 1588cm-', as well as
Raman-active vibrational modes at 42, 1581, and 2710cm-'. The Raman scans of
Fig. 8.17 show (a) the very narrow diamond line at 1332cm-', and (b) the narrow
graphite stretching mode line at 1581 cm-', which is called the G band. Micro2
I
: 12
800 "C
750 "C
4
0
20
40
60
80
100 120 140
Annealing Time (minutes)
Figure 8.13. Plot of particle size estimated from the full width at half-maximum height (FWHM)
of a Ge Raman line versus the annealing time at three temperatures. [From D. C. Paine,
C. Caragiantis, T. Y. Kim, Y. Shigesato, and T. Ishahara, Appl. Phys. Lett 62, 2842 (1993).]
205
and 13nm, which increases with an increase in either the temperature or the
annealing time, in accordance with the results plotted in Fig. 8.13.
Silicon nanoparticles exhibit the same behavior as their germanium counterparts
for the r& optical phonon mode, which in this case is centered at 521 cm-', as
indicated in Fig. 8.14. This figure illustrates how the Raman line from fine-grained
polycrystalline Si broadens and shifts to lower wavenumbers from the single-crystal
spectrum. The normalized scans in Fig. 8.15 provide the evolution of the Raman line
for spherical Si nanoparticles as the particle diameter decreases from infinity in bulk
material to 3nm. The dependence of the position of the peak absorption on the
microcrystallite size is reported in Fig. 8.16 for annealed and unannealed samples of
Si. The broadening and shift of the Si and Ge Raman lines to lower frequencies as
the particle size decreases has been attributed to phonon confinement effects in the
nanocrystals.
Raman spectra have been widely used to study carbon in its various crystallographic or allotropic forms. Diamond with the tetrahedrally bonded crystal structure
sketched in Fig. 2.8a and graphite whose structure consists of stacked planar
hexagonal sheets of the type sketched in Fig. 5.14, are the two traditional allotropic
forms of diamond. More recently hllerenes such as C60 and nanotubes, which are
discussed at length in Chapter 5, have been discovered, and are alternate allotropic
forms of carbon. The Raman spectrum of diamond has a sharp line at 1332 cm-',
while graphite has infrared-active vibrations at 867 and 1588cm-', as well as
Raman-active vibrational modes at 42, 1581, and 2710cm-'. The Raman scans of
Fig. 8.17 show (a) the very narrow diamond line at 1332cm-', and (b) the narrow
graphite stretching mode line at 1581 cm-', which is called the G band. Micro2
I
: 12
800 "C
750 "C
4
0
20
40
60
80
100 120 140
Annealing Time (minutes)
Figure 8.13. Plot of particle size estimated from the full width at half-maximum height (FWHM)
of a Ge Raman line versus the annealing time at three temperatures. [From D. C. Paine,
C. Caragiantis, T. Y. Kim, Y. Shigesato, and T. Ishahara, Appl. Phys. Lett 62, 2842 (1993).]