

204
OPTICAL AND VIBRATIONAL SPECTROSCOPY
350
300
250
200
RAMAN SHIFT (cm-1)
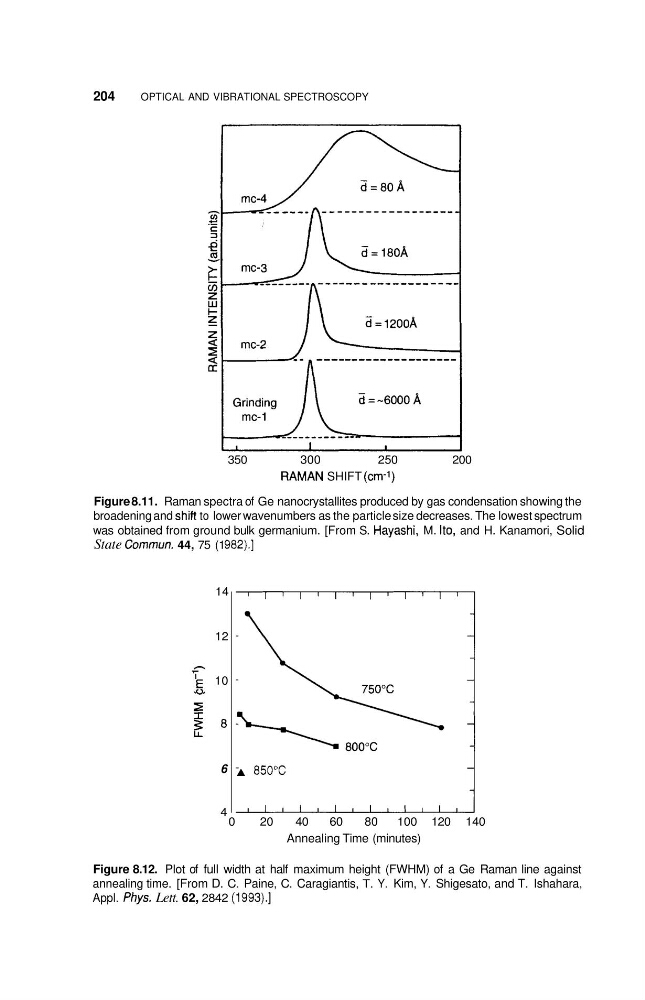
Figure 8.11. Raman spectra of Ge nanocrystallites produced by gas condensation showing the
broadening and shift to lower wavenumbers as the particle size decreases. The lowest spectrum
was obtained from ground bulk germanium. [From S. Hayashi, M. Ito, and H. Kanamori, Solid
State Commun. 44, 75 (1 982).]
14
12
h
r
1
10
v 6
f
Z 8
6 A 850°C
4
0
20
40
60
80
100 120 140
Annealing Time (minutes)
Figure 8.12. Plot of full width at half maximum height (FWHM) of a Ge Raman line against
annealing time. [From D. C. Paine, C. Caragiantis, T. Y. Kim, Y. Shigesato, and T. Ishahara,
Appl. fhys. Lett. 62, 2842 (1993).]
OPTICAL AND VIBRATIONAL SPECTROSCOPY
350
300
250
200
RAMAN SHIFT (cm-1)
Figure 8.11. Raman spectra of Ge nanocrystallites produced by gas condensation showing the
broadening and shift to lower wavenumbers as the particle size decreases. The lowest spectrum
was obtained from ground bulk germanium. [From S. Hayashi, M. Ito, and H. Kanamori, Solid
State Commun. 44, 75 (1 982).]
14
12
h
r
1
10
v 6
f
Z 8
6 A 850°C
4
0
20
40
60
80
100 120 140
Annealing Time (minutes)
Figure 8.12. Plot of full width at half maximum height (FWHM) of a Ge Raman line against
annealing time. [From D. C. Paine, C. Caragiantis, T. Y. Kim, Y. Shigesato, and T. Ishahara,
Appl. fhys. Lett. 62, 2842 (1993).]