

210
OPTICAL AND VIBRATIONAL SPECTROSCOPY
10
I
I I I I I I I I
I
I
I I 1 1 1 1 1
0.01
0.1
1
5
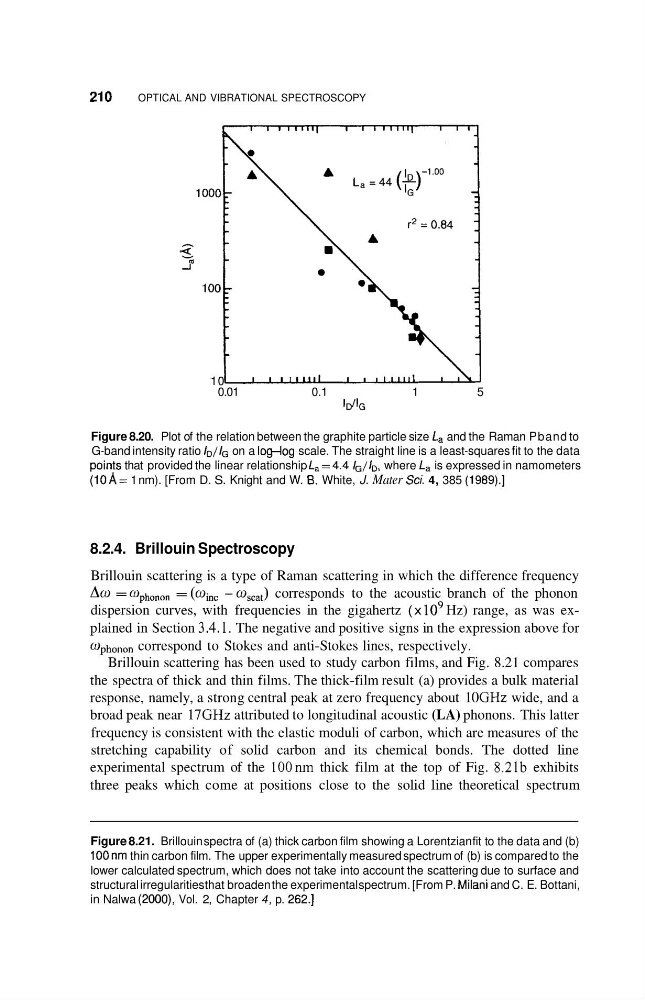
Figure 8.20. Plot of the relation between the graphite particle size La and the Raman Pband to
G-band intensity ratio $/IG on a log-!og scale. The straight line is a least-squares fit to the data
pain$ that provided the linear relationship L,=4.4 /G//D, where La is expressed in namometers
(10A= 1 nm). [From D. S. Knight and W. 6. White, J. Mater Sci. 4, 385 (1989).]
8.2.4. Brillouin Spectroscopy
Brillouin scattering is a type of Raman scattering in which the difference frequency
Aw = w~~~~~~ = (qnc - w,,,~) corresponds to the acoustic branch of the phonon
dispersion curves, with frequencies in the gigahertz ( x lo9 Hz) range, as was explained in Section 3.4.1. The negative and positive signs in the expression above for
cL)pho,,on correspond to Stokes and anti-Stokes lines, respectively.
Brillouin scattering has been used to study carbon films, and Fig. 8.21 compares
the spectra of thick and thin films. The thick-film result (a) provides a bulk material
response, namely, a strong central peak at zero frequency about 10 GHz wide, and a
broad peak near 17 GHz attributed to longitudinal acoustic (LA) phonons. This latter
frequency is consistent with the elastic moduli of carbon, which are measures of the
stretching capability of solid carbon and its chemical bonds. The dotted line
experimental spectrum of the lOOnm thick film at the top of Fig. 8.21b exhibits
three peaks which come at positions close to the solid line theoretical spectrum
Figure 8.21. Brillouin spectra of (a) thick carbon film showing a Lorentzian fit to the data and (b)
100nm thin carbon film. The upper experimentally measured spectrum of (b) is compared to the
lower calculated spectrum, which does not take into account the scattering due to surface and
structural irregularities that broaden the experimental spectrum. [From P. Milani and C. E. Bottani,
in Nalwa (2000), Vol. 2, Chapter 4, p. 262.1
OPTICAL AND VIBRATIONAL SPECTROSCOPY
10
I
I I I I I I I I
I
I
I I 1 1 1 1 1
0.01
0.1
1
5
Figure 8.20. Plot of the relation between the graphite particle size La and the Raman Pband to
G-band intensity ratio $/IG on a log-!og scale. The straight line is a least-squares fit to the data
pain$ that provided the linear relationship L,=4.4 /G//D, where La is expressed in namometers
(10A= 1 nm). [From D. S. Knight and W. 6. White, J. Mater Sci. 4, 385 (1989).]
8.2.4. Brillouin Spectroscopy
Brillouin scattering is a type of Raman scattering in which the difference frequency
Aw = w~~~~~~ = (qnc - w,,,~) corresponds to the acoustic branch of the phonon
dispersion curves, with frequencies in the gigahertz ( x lo9 Hz) range, as was explained in Section 3.4.1. The negative and positive signs in the expression above for
cL)pho,,on correspond to Stokes and anti-Stokes lines, respectively.
Brillouin scattering has been used to study carbon films, and Fig. 8.21 compares
the spectra of thick and thin films. The thick-film result (a) provides a bulk material
response, namely, a strong central peak at zero frequency about 10 GHz wide, and a
broad peak near 17 GHz attributed to longitudinal acoustic (LA) phonons. This latter
frequency is consistent with the elastic moduli of carbon, which are measures of the
stretching capability of solid carbon and its chemical bonds. The dotted line
experimental spectrum of the lOOnm thick film at the top of Fig. 8.21b exhibits
three peaks which come at positions close to the solid line theoretical spectrum
Figure 8.21. Brillouin spectra of (a) thick carbon film showing a Lorentzian fit to the data and (b)
100nm thin carbon film. The upper experimentally measured spectrum of (b) is compared to the
lower calculated spectrum, which does not take into account the scattering due to surface and
structural irregularities that broaden the experimental spectrum. [From P. Milani and C. E. Bottani,
in Nalwa (2000), Vol. 2, Chapter 4, p. 262.1