

8.2. INFRARED FREQUENCY RANGE
197
1.42
1.44
1.46
1.48
1.50
1.52
1.54
Photon energy [eV]
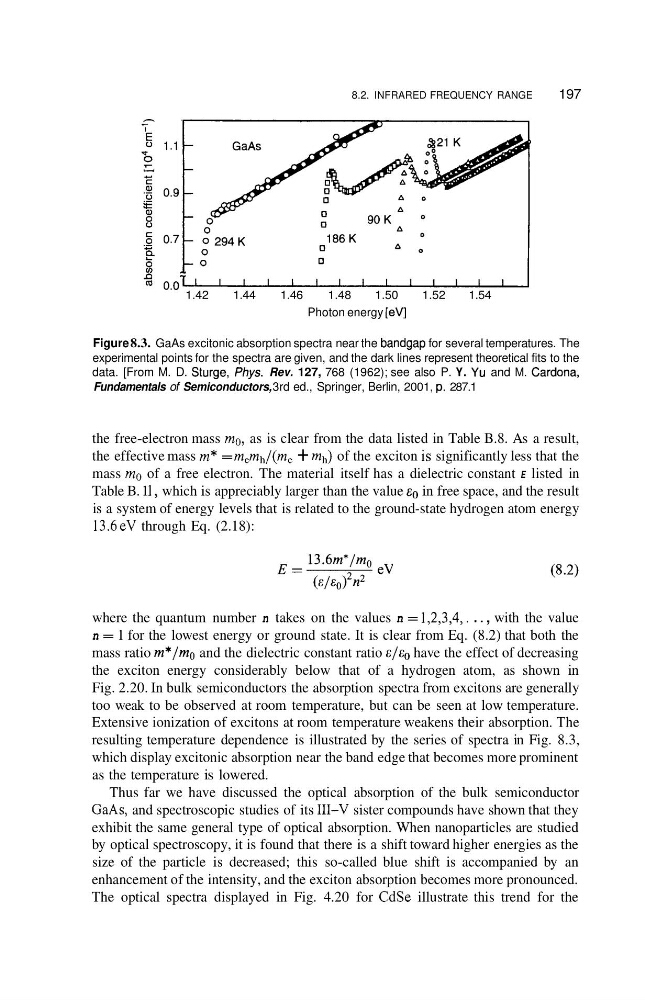
Figure 8.3. GaAs excitonic absorption spectra near the bandgap for several temperatures. The
experimental points for the spectra are given, and the dark lines represent theoretical fits to the
data. [From M. D. Sturge, Phys. Rev. 127, 768 (1962); see also P. Y. Yu and M. Cardona,
Fundamentals of Semiconductors, 3rd ed., Springer, Berlin, 2001, p. 287.1
the free-electron mass mo, as is clear from the data listed in Table B.8. As a result,
the effective mass m* = memh/(me + mh) of the exciton is significantly less that the
mass mo of a free electron. The material itself has a dielectric constant E listed in
Table B. 1 1, which is appreciably larger than the value in free space, and the result
is a system of energy levels that is related to the ground-state hydrogen atom energy
13.6eV through Eq. (2.18):
where the quantum number n takes on the values n = 1,2,3,4,. . . , with the value
n = 1 for the lowest energy or ground state. It is clear from Eq. (8.2) that both the
mass ratio m*/mo and the dielectric constant ratio & / E o have the effect of decreasing
the exciton energy considerably below that of a hydrogen atom, as shown in
Fig. 2.20. In bulk semiconductors the absorption spectra from excitons are generally
too weak to be observed at room temperature, but can be seen at low temperature.
Extensive ionization of excitons at room temperature weakens their absorption. The
resulting temperature dependence is illustrated by the series of spectra in Fig. 8.3,
which display excitonic absorption near the band edge that becomes more prominent
as the temperature is lowered.
Thus far we have discussed the optical absorption of the bulk semiconductor
GaAs, and spectroscopic studies of its 111-V sister compounds have shown that they
exhibit the same general type of optical absorption. When nanoparticles are studied
by optical spectroscopy, it is found that there is a shift toward higher energies as the
size of the particle is decreased; this so-called blue shift is accompanied by an
enhancement of the intensity, and the exciton absorption becomes more pronounced.
The optical spectra displayed in Fig. 4.20 for CdSe illustrate this trend for the
197
1.42
1.44
1.46
1.48
1.50
1.52
1.54
Photon energy [eV]
Figure 8.3. GaAs excitonic absorption spectra near the bandgap for several temperatures. The
experimental points for the spectra are given, and the dark lines represent theoretical fits to the
data. [From M. D. Sturge, Phys. Rev. 127, 768 (1962); see also P. Y. Yu and M. Cardona,
Fundamentals of Semiconductors, 3rd ed., Springer, Berlin, 2001, p. 287.1
the free-electron mass mo, as is clear from the data listed in Table B.8. As a result,
the effective mass m* = memh/(me + mh) of the exciton is significantly less that the
mass mo of a free electron. The material itself has a dielectric constant E listed in
Table B. 1 1, which is appreciably larger than the value in free space, and the result
is a system of energy levels that is related to the ground-state hydrogen atom energy
13.6eV through Eq. (2.18):
where the quantum number n takes on the values n = 1,2,3,4,. . . , with the value
n = 1 for the lowest energy or ground state. It is clear from Eq. (8.2) that both the
mass ratio m*/mo and the dielectric constant ratio & / E o have the effect of decreasing
the exciton energy considerably below that of a hydrogen atom, as shown in
Fig. 2.20. In bulk semiconductors the absorption spectra from excitons are generally
too weak to be observed at room temperature, but can be seen at low temperature.
Extensive ionization of excitons at room temperature weakens their absorption. The
resulting temperature dependence is illustrated by the series of spectra in Fig. 8.3,
which display excitonic absorption near the band edge that becomes more prominent
as the temperature is lowered.
Thus far we have discussed the optical absorption of the bulk semiconductor
GaAs, and spectroscopic studies of its 111-V sister compounds have shown that they
exhibit the same general type of optical absorption. When nanoparticles are studied
by optical spectroscopy, it is found that there is a shift toward higher energies as the
size of the particle is decreased; this so-called blue shift is accompanied by an
enhancement of the intensity, and the exciton absorption becomes more pronounced.
The optical spectra displayed in Fig. 4.20 for CdSe illustrate this trend for the