

168
NANOSTRUCTURED FERROMAGNETISM
interaction, which can occur in a lattice of magnetic ions, is called the
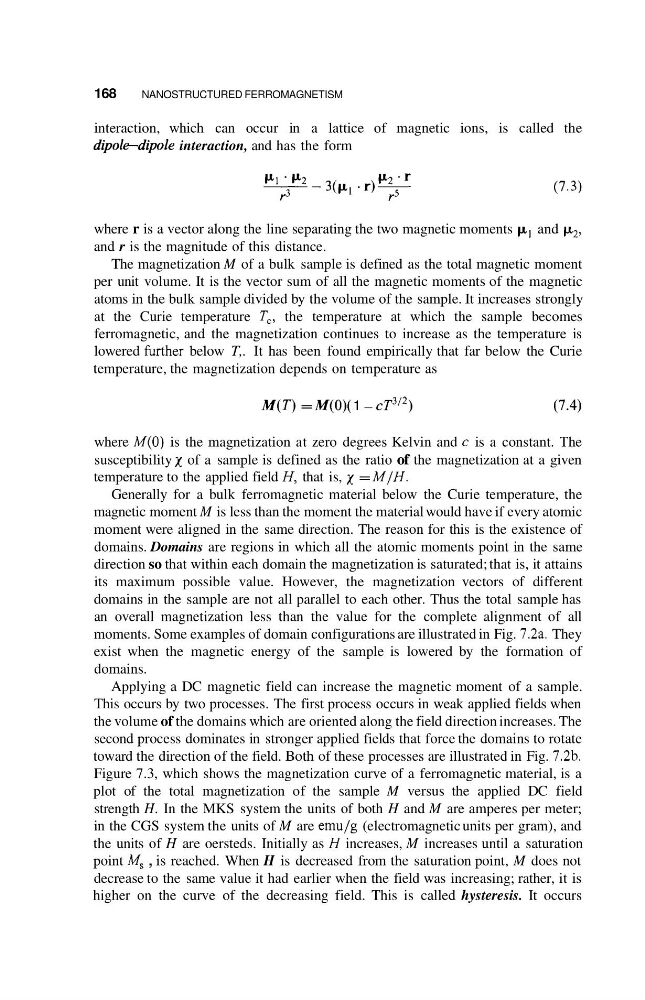
dipoledipole interaction, and has the form
(7.3)
where r is a vector along the line separating the two magnetic moments pl and p2,
and r is the magnitude of this distance.
The magnetization M of a bulk sample is defined as the total magnetic moment
per unit volume. It is the vector sum of all the magnetic moments of the magnetic
atoms in the bulk sample divided by the volume of the sample. It increases strongly
at the Curie temperature T,, the temperature at which the sample becomes
ferromagnetic, and the magnetization continues to increase as the temperature is
lowered hrther below T,. It has been found empirically that far below the Curie
temperature, the magnetization depends on temperature as
M ( T ) = M(O)( 1 - CT3'2)
(7.4)
where M(0) is the magnetization at zero degrees Kelvin and c is a constant. The
susceptibility of a sample is defined as the ratio of the magnetization at a given
temperature to the applied field H, that is, x = M / H .
Generally for a bulk ferromagnetic material below the Curie temperature, the
magnetic moment M is less than the moment the material would have if every atomic
moment were aligned in the same direction. The reason for this is the existence of
domains. Domains are regions in which all the atomic moments point in the same
direction so that within each domain the magnetization is saturated; that is, it attains
its maximum possible value. However, the magnetization vectors of different
domains in the sample are not all parallel to each other. Thus the total sample has
an overall magnetization less than the value for the complete alignment of all
moments. Some examples of domain configurations are illustrated in Fig. 7.2a. They
exist when the magnetic energy of the sample is lowered by the formation of
domains.
Applying a DC magnetic field can increase the magnetic moment of a sample.
This occurs by two processes. The first process occurs in weak applied fields when
the volume of the domains which are oriented along the field direction increases. The
second process dominates in stronger applied fields that force the domains to rotate
toward the direction of the field. Both of these processes are illustrated in Fig. 7.2b.
Figure 7.3, which shows the magnetization curve of a ferromagnetic material, is a
plot of the total magnetization of the sample M versus the applied DC field
strength H. In the MKS system the units of both H and M are amperes per meter;
in the CGS system the units of M are emu/g (electromagnetic units per gram), and
the units of H are oersteds. Initially as H increases, M increases until a saturation
point M, , is reached. When H is decreased from the saturation point, M does not
decrease to the same value it had earlier when the field was increasing; rather, it is
higher on the curve of the decreasing field. This is called hysteresis. It occurs
NANOSTRUCTURED FERROMAGNETISM
interaction, which can occur in a lattice of magnetic ions, is called the
dipoledipole interaction, and has the form
(7.3)
where r is a vector along the line separating the two magnetic moments pl and p2,
and r is the magnitude of this distance.
The magnetization M of a bulk sample is defined as the total magnetic moment
per unit volume. It is the vector sum of all the magnetic moments of the magnetic
atoms in the bulk sample divided by the volume of the sample. It increases strongly
at the Curie temperature T,, the temperature at which the sample becomes
ferromagnetic, and the magnetization continues to increase as the temperature is
lowered hrther below T,. It has been found empirically that far below the Curie
temperature, the magnetization depends on temperature as
M ( T ) = M(O)( 1 - CT3'2)
(7.4)
where M(0) is the magnetization at zero degrees Kelvin and c is a constant. The
susceptibility of a sample is defined as the ratio of the magnetization at a given
temperature to the applied field H, that is, x = M / H .
Generally for a bulk ferromagnetic material below the Curie temperature, the
magnetic moment M is less than the moment the material would have if every atomic
moment were aligned in the same direction. The reason for this is the existence of
domains. Domains are regions in which all the atomic moments point in the same
direction so that within each domain the magnetization is saturated; that is, it attains
its maximum possible value. However, the magnetization vectors of different
domains in the sample are not all parallel to each other. Thus the total sample has
an overall magnetization less than the value for the complete alignment of all
moments. Some examples of domain configurations are illustrated in Fig. 7.2a. They
exist when the magnetic energy of the sample is lowered by the formation of
domains.
Applying a DC magnetic field can increase the magnetic moment of a sample.
This occurs by two processes. The first process occurs in weak applied fields when
the volume of the domains which are oriented along the field direction increases. The
second process dominates in stronger applied fields that force the domains to rotate
toward the direction of the field. Both of these processes are illustrated in Fig. 7.2b.
Figure 7.3, which shows the magnetization curve of a ferromagnetic material, is a
plot of the total magnetization of the sample M versus the applied DC field
strength H. In the MKS system the units of both H and M are amperes per meter;
in the CGS system the units of M are emu/g (electromagnetic units per gram), and
the units of H are oersteds. Initially as H increases, M increases until a saturation
point M, , is reached. When H is decreased from the saturation point, M does not
decrease to the same value it had earlier when the field was increasing; rather, it is
higher on the curve of the decreasing field. This is called hysteresis. It occurs