

E1C02 09/14/2010
13:35:19 Page 68
Example 2.7
Estimate the amplitude spectrum of the discrete data set in Example 2.6.
KNOWN Discrete data set {y(rdt)} of Table 2.2
dt ¼ 0:125 s
N ¼ 8
FIND C(f)
SOLUTION We can use either the Matlab Fourier transform software (file FunSpect), the
LabView program WaveformGeneration, or a spreadsheet program to find C(f) (see the Comment
for details). For N ¼ 8, a one-sided Fourier transform algorithm will return N/2 values for C(f),
with each successive amplitude corresponding to a frequency spaced at intervals of
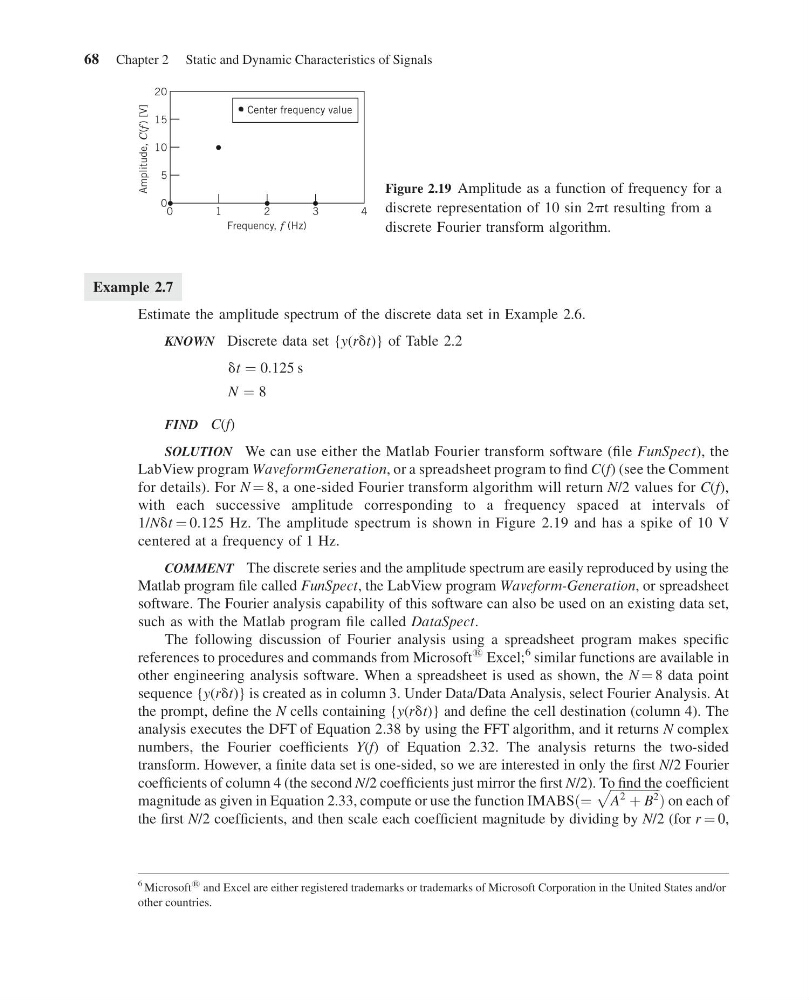
1/Ndt ¼ 0.125 Hz. The amplitude spectrum is shown in Figure 2.19 and has a spike of 10 V
centered at a frequency of 1 Hz.
COMMENT The discrete series and the amplitude spectrum are easily reproduced by using the
Matlab program file called FunSpect, the LabView program Waveform-Generation, or spreadsheet
software. The Fourier analysis capability of this software can also be used on an existing data set,
such as with the Matlab program file called DataSpect.
The following discussion of Fourier analysis using a spreadsheet program makes specific
references to procedures and commands from Microsoft
1 Excel;
6 similar functions are available in
other engineering analysis software. When a spreadsheet is used as shown, the N ¼ 8 data point
sequence {y(rdt)} is created as in column 3. Under Data/Data Analysis, select Fourier Analysis. At
the prompt, define the N cells containing {y(rdt)} and define the cell destination (column 4). The
analysis executes the DFT of Equation 2.38 by using the FFT algorithm, and it returns N complex
numbers, the Fourier coefficients Y(f) of Equation 2.32. The analysis returns the two-sided
transform. However, a finite data set is one-sided, so we are interested in only the first N/2 Fourier
coefficients of column 4 (the second N/2 coefficients just mirror the first N/2). To find the coefficient
magnitude as given in Equation 2.33, compute or use the function IMABSð¼
ffiffiffiffiffiffiffiffiffiffiffiffiffiffiffiffi
A
2
þ B
2
p
Þ on each of
the first N/2 coefficients, and then scale each coefficient magnitude by dividing by N/2 (for r ¼ 0,
0
0
10
15
20
5
1
4
3
2
Frequency, f (Hz)
Center frequency value
Amplitude,
C(f ) [V]
Figure 2.19 Amplitude as a function of frequency for a
discrete representation of 10 sin 2pt resulting from a
discrete Fourier transform algorithm.
6 Microsoft
1 and Excel are either registered trademarks or trademarks of Microsoft Corporation in the United States and/or
other countries.
68 Chapter 2 Static and Dynamic Characteristics of Signals
13:35:19 Page 68
Example 2.7
Estimate the amplitude spectrum of the discrete data set in Example 2.6.
KNOWN Discrete data set {y(rdt)} of Table 2.2
dt ¼ 0:125 s
N ¼ 8
FIND C(f)
SOLUTION We can use either the Matlab Fourier transform software (file FunSpect), the
LabView program WaveformGeneration, or a spreadsheet program to find C(f) (see the Comment
for details). For N ¼ 8, a one-sided Fourier transform algorithm will return N/2 values for C(f),
with each successive amplitude corresponding to a frequency spaced at intervals of
1/Ndt ¼ 0.125 Hz. The amplitude spectrum is shown in Figure 2.19 and has a spike of 10 V
centered at a frequency of 1 Hz.
COMMENT The discrete series and the amplitude spectrum are easily reproduced by using the
Matlab program file called FunSpect, the LabView program Waveform-Generation, or spreadsheet
software. The Fourier analysis capability of this software can also be used on an existing data set,
such as with the Matlab program file called DataSpect.
The following discussion of Fourier analysis using a spreadsheet program makes specific
references to procedures and commands from Microsoft
1 Excel;
6 similar functions are available in
other engineering analysis software. When a spreadsheet is used as shown, the N ¼ 8 data point
sequence {y(rdt)} is created as in column 3. Under Data/Data Analysis, select Fourier Analysis. At
the prompt, define the N cells containing {y(rdt)} and define the cell destination (column 4). The
analysis executes the DFT of Equation 2.38 by using the FFT algorithm, and it returns N complex
numbers, the Fourier coefficients Y(f) of Equation 2.32. The analysis returns the two-sided
transform. However, a finite data set is one-sided, so we are interested in only the first N/2 Fourier
coefficients of column 4 (the second N/2 coefficients just mirror the first N/2). To find the coefficient
magnitude as given in Equation 2.33, compute or use the function IMABSð¼
ffiffiffiffiffiffiffiffiffiffiffiffiffiffiffiffi
A
2
þ B
2
p
Þ on each of
the first N/2 coefficients, and then scale each coefficient magnitude by dividing by N/2 (for r ¼ 0,
0
0
10
15
20
5
1
4
3
2
Frequency, f (Hz)
Center frequency value
Amplitude,
C(f ) [V]
Figure 2.19 Amplitude as a function of frequency for a
discrete representation of 10 sin 2pt resulting from a
discrete Fourier transform algorithm.
6 Microsoft
1 and Excel are either registered trademarks or trademarks of Microsoft Corporation in the United States and/or
other countries.
68 Chapter 2 Static and Dynamic Characteristics of Signals