

E1C02 09/14/2010
13:35:19 Page 69
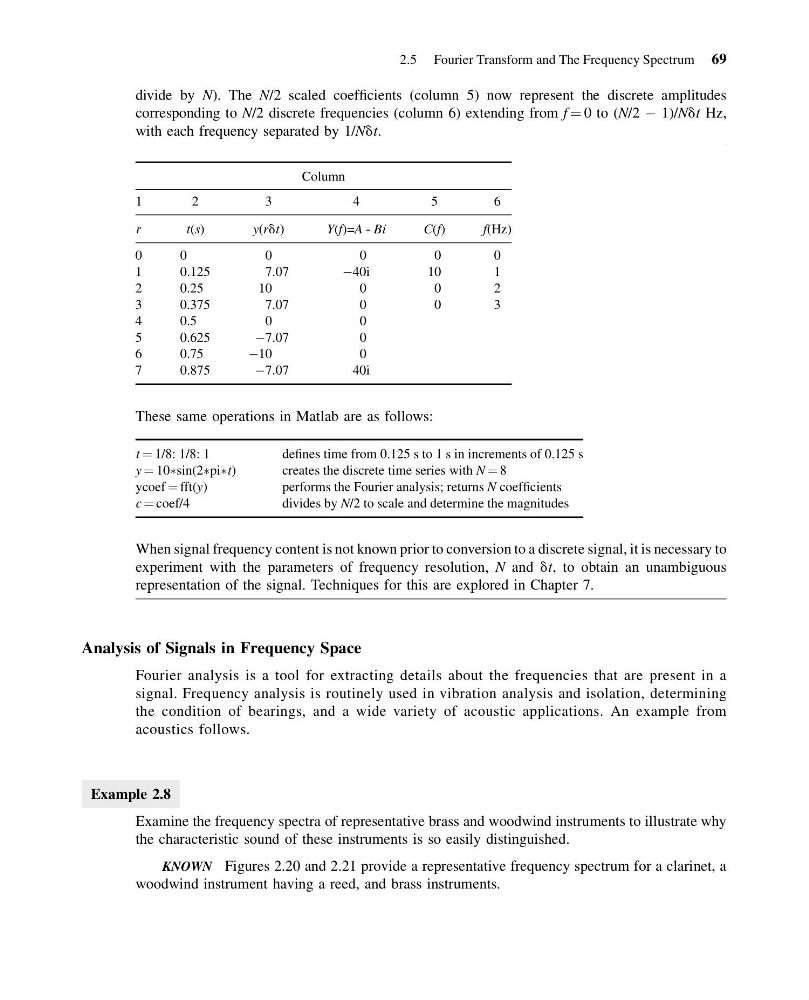
divide by N). The N/2 scaled coefficients (column 5) now represent the discrete amplitudes
corresponding to N/2 discrete frequencies (column 6) extending from f ¼ 0 to (N/2 À 1)/Ndt Hz,
with each frequency separated by 1/Ndt.
Column
1
2
3
4
5
6
r
t (s)
y(rdt)
Y(f)=A - Bi
C(f)
f(Hz)
0
0
0
0
0
0
1
0.125
7.07
À40i
10
1
2
0.25
10
0
0
2
3
0.375
7.07
0
0
3
4
0.5
0
0
5
0.625
À7.07
0
6
0.75
À10
0
7
0.875
À7.07
40i
These same operations in Matlab are as follows:
t ¼ 1/8: 1/8: 1
defines time from 0.125 s to 1 s in increments of 0.125 s
y ¼ 10Ãsin(2ÃpiÃt)
creates the discrete time series with N ¼ 8
ycoef ¼ fft(y)
performs the Fourier analysis; returns N coefficients
c ¼ coef/4
divides by N/2 to scale and determine the magnitudes
When signal frequency content is not known prior to conversion to a discrete signal, it is necessary to
experiment with the parameters of frequency resolution, N and dt, to obtain an unambiguous
representation of the signal. Techniques for this are explored in Chapter 7.
Analysis of Signals in Frequency Space
Fourier analysis is a tool for extracting details about the frequencies that are present in a
signal. Frequency analysis is routinely used in vibration analysis and isolation, determining
the condition of bearings, and a wide variety of acoustic applications. An example from
acoustics follows.
Example 2.8
Examine the frequency spectra of representative brass and woodwind instruments to illustrate why
the characteristic sound of these instruments is so easily distinguished.
KNOWN Figures 2.20 and 2.21 provide a representative frequency spectrum for a clarinet, a
woodwind instrument having a reed, and brass instruments.
2.5 Fourier Transform and The Frequency Spectrum 69
13:35:19 Page 69
divide by N). The N/2 scaled coefficients (column 5) now represent the discrete amplitudes
corresponding to N/2 discrete frequencies (column 6) extending from f ¼ 0 to (N/2 À 1)/Ndt Hz,
with each frequency separated by 1/Ndt.
Column
1
2
3
4
5
6
r
t (s)
y(rdt)
Y(f)=A - Bi
C(f)
f(Hz)
0
0
0
0
0
0
1
0.125
7.07
À40i
10
1
2
0.25
10
0
0
2
3
0.375
7.07
0
0
3
4
0.5
0
0
5
0.625
À7.07
0
6
0.75
À10
0
7
0.875
À7.07
40i
These same operations in Matlab are as follows:
t ¼ 1/8: 1/8: 1
defines time from 0.125 s to 1 s in increments of 0.125 s
y ¼ 10Ãsin(2ÃpiÃt)
creates the discrete time series with N ¼ 8
ycoef ¼ fft(y)
performs the Fourier analysis; returns N coefficients
c ¼ coef/4
divides by N/2 to scale and determine the magnitudes
When signal frequency content is not known prior to conversion to a discrete signal, it is necessary to
experiment with the parameters of frequency resolution, N and dt, to obtain an unambiguous
representation of the signal. Techniques for this are explored in Chapter 7.
Analysis of Signals in Frequency Space
Fourier analysis is a tool for extracting details about the frequencies that are present in a
signal. Frequency analysis is routinely used in vibration analysis and isolation, determining
the condition of bearings, and a wide variety of acoustic applications. An example from
acoustics follows.
Example 2.8
Examine the frequency spectra of representative brass and woodwind instruments to illustrate why
the characteristic sound of these instruments is so easily distinguished.
KNOWN Figures 2.20 and 2.21 provide a representative frequency spectrum for a clarinet, a
woodwind instrument having a reed, and brass instruments.
2.5 Fourier Transform and The Frequency Spectrum 69