

E1C09 09/14/2010
15:4:54 Page 393
frequency response. The frequency response can be found directly by applying a constant amplitude
periodic input signal and varying its frequency. A flush-mounted transducer places the sensor in
direct contact with the fluid at the measurement site. Because pressure transducers could also be
attached by means of a pressure tap or by connecting tubing to the tap, this length (called the
transmission line) affects the overall response and should be included as part of the dynamic
calibration.
An electrical switching valve or flow control valve can create a step change in pressure. But the
mechanical lag of the valve limits its use to transducers having an expected rise time of 50 ms or
more. Faster applications might use a shock tube calibration or some equivalent diaphragm burst test.
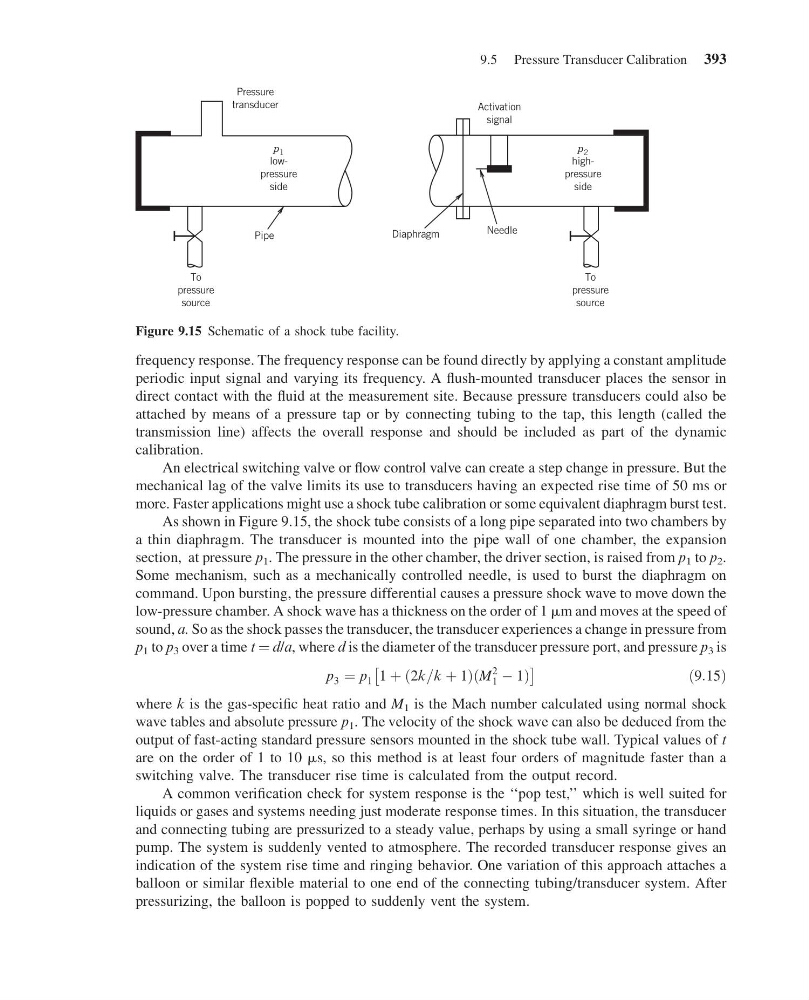
As shown in Figure 9.15, the shock tube consists of a long pipe separated into two chambers by
a thin diaphragm. The transducer is mounted into the pipe wall of one chamber, the expansion
section, at pressure p 1 . The pressure in the other chamber, the driver section, is raised from p 1 to p 2 .
Some mechanism, such as a mechanically controlled needle, is used to burst the diaphragm on
command. Upon bursting, the pressure differential causes a pressure shock wave to move down the
low-pressure chamber. A shock wave has a thickness on the order of 1 mm and moves at the speed of
sound, a. So as the shock passes the transducer, the transducer experiences a change in pressure from
p 1 to p 3 over a time t ¼ d/a, where d is the diameter of the transducer pressure port, and pressure p 3 is
p 3 ¼ p 1 1 þ ð2k=k þ 1ÞðM
2
1 À 1Þ
Â
Ã
ð9:15Þ
where k is the gas-specific heat ratio and M 1 is the Mach number calculated using normal shock
wave tables and absolute pressure p 1 . The velocity of the shock wave can also be deduced from the
output of fast-acting standard pressure sensors mounted in the shock tube wall. Typical values of t
are on the order of 1 to 10 ms, so this method is at least four orders of magnitude faster than a
switching valve. The transducer rise time is calculated from the output record.
A common verification check for system response is the ‘‘pop test,’’ which is well suited for
liquids or gases and systems needing just moderate response times. In this situation, the transducer
and connecting tubing are pressurized to a steady value, perhaps by using a small syringe or hand
pump. The system is suddenly vented to atmosphere. The recorded transducer response gives an
indication of the system rise time and ringing behavior. One variation of this approach attaches a
balloon or similar flexible material to one end of the connecting tubing/transducer system. After
pressurizing, the balloon is popped to suddenly vent the system.
Pressure
transducer
Pipe
To
pressure
source
To
pressure
source
p 1
lowpressure
side
Activation
signal
Diaphragm
p 2
highpressure
side
Needle
Figure 9.15 Schematic of a shock tube facility.
9.5 Pressure Transducer Calibration 393
15:4:54 Page 393
frequency response. The frequency response can be found directly by applying a constant amplitude
periodic input signal and varying its frequency. A flush-mounted transducer places the sensor in
direct contact with the fluid at the measurement site. Because pressure transducers could also be
attached by means of a pressure tap or by connecting tubing to the tap, this length (called the
transmission line) affects the overall response and should be included as part of the dynamic
calibration.
An electrical switching valve or flow control valve can create a step change in pressure. But the
mechanical lag of the valve limits its use to transducers having an expected rise time of 50 ms or
more. Faster applications might use a shock tube calibration or some equivalent diaphragm burst test.
As shown in Figure 9.15, the shock tube consists of a long pipe separated into two chambers by
a thin diaphragm. The transducer is mounted into the pipe wall of one chamber, the expansion
section, at pressure p 1 . The pressure in the other chamber, the driver section, is raised from p 1 to p 2 .
Some mechanism, such as a mechanically controlled needle, is used to burst the diaphragm on
command. Upon bursting, the pressure differential causes a pressure shock wave to move down the
low-pressure chamber. A shock wave has a thickness on the order of 1 mm and moves at the speed of
sound, a. So as the shock passes the transducer, the transducer experiences a change in pressure from
p 1 to p 3 over a time t ¼ d/a, where d is the diameter of the transducer pressure port, and pressure p 3 is
p 3 ¼ p 1 1 þ ð2k=k þ 1ÞðM
2
1 À 1Þ
Â
Ã
ð9:15Þ
where k is the gas-specific heat ratio and M 1 is the Mach number calculated using normal shock
wave tables and absolute pressure p 1 . The velocity of the shock wave can also be deduced from the
output of fast-acting standard pressure sensors mounted in the shock tube wall. Typical values of t
are on the order of 1 to 10 ms, so this method is at least four orders of magnitude faster than a
switching valve. The transducer rise time is calculated from the output record.
A common verification check for system response is the ‘‘pop test,’’ which is well suited for
liquids or gases and systems needing just moderate response times. In this situation, the transducer
and connecting tubing are pressurized to a steady value, perhaps by using a small syringe or hand
pump. The system is suddenly vented to atmosphere. The recorded transducer response gives an
indication of the system rise time and ringing behavior. One variation of this approach attaches a
balloon or similar flexible material to one end of the connecting tubing/transducer system. After
pressurizing, the balloon is popped to suddenly vent the system.
Pressure
transducer
Pipe
To
pressure
source
To
pressure
source
p 1
lowpressure
side
Activation
signal
Diaphragm
p 2
highpressure
side
Needle
Figure 9.15 Schematic of a shock tube facility.
9.5 Pressure Transducer Calibration 393