

E1C01 09/14/2010
15:40:35 Page 20
Sequential Test
A sequential test applies a sequential variation in the input value over the desired input range. This
may be accomplished by increasing the input value (upscale direction) or by decreasing the input
value (downscale direction) over the full input range.
Hysteresis
The sequential test is an effective diagnostic technique for identifying and quantifying hysteresis
error in a measurement system. Hysteresis error refers to differences between an upscale
sequential test and a downscale sequential test. The hysteresis error of the system is estimated
by its uncertainty u h ¼ y
ð Þ upscale À y
ð Þ downscale . The effect of hysteresis in a sequential test
calibration curve is illustrated in Figure 1.13a. Hysteresis is usually specified for a measurement
system in terms of the maximum hysteresis error as a percentage of full-scale output range, r o ,
%u h max ¼
u h max
r o
 100
ð1:6Þ
such as the value indicated in Table 1.1. Hysteresis occurs when the output of a measurement
system is dependent on the previous value indicated by the system. Such dependencies can be
brought about through some realistic system limitations such as friction or viscous damping in
moving parts or residual charge in electrical components. Some hysteresis is normal for any system
and affects the repeatability of the system.
Random Test
A random test applies a random order in the values of a known input over the intended calibration
range. The random application of input tends to reduce the impact of interference. It breaks up
hysteresis effects and observation errors. It ensures that each application of input value is
independent of the previous. As such, it reduces calibration systematic error, converting it to
random error. Generally, such a random variation in input value will more closely simulate the actual
measurement situation.
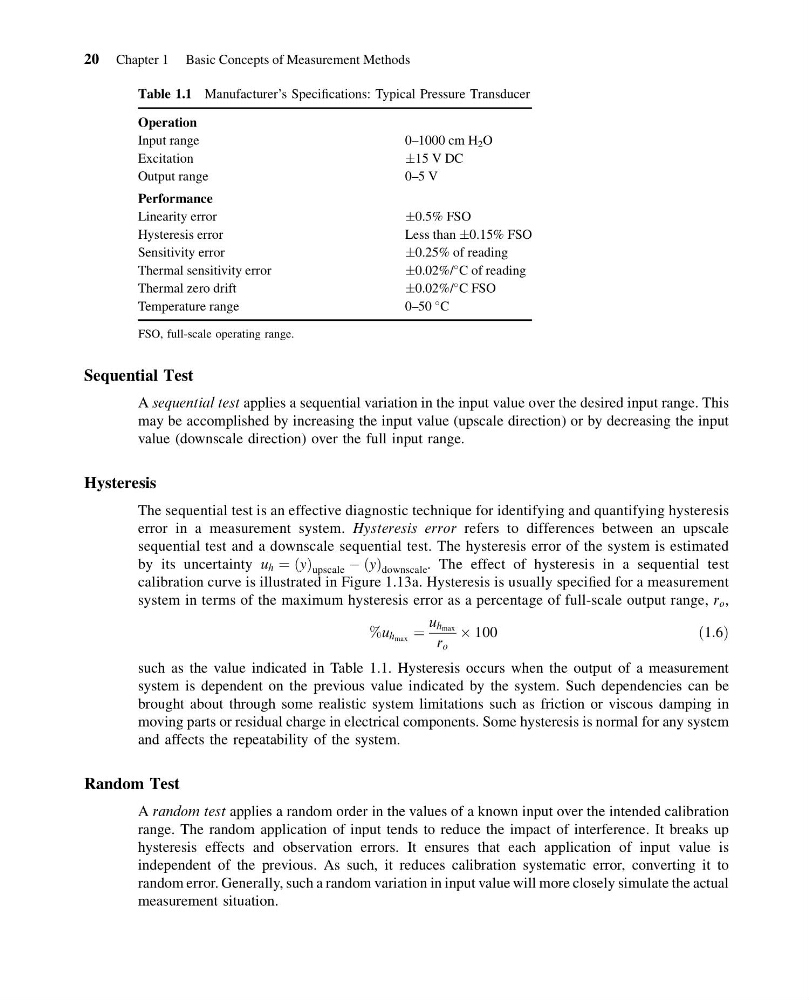
Table 1.1 Manufacturer’s Specifications: Typical Pressure Transducer
Operation
Input range
0–1000 cm H 2 O
Excitation
Æ15 V DC
Output range
0–5 V
Performance
Linearity error
Æ0.5% FSO
Hysteresis error
Less than Æ0.15% FSO
Sensitivity error
Æ0.25% of reading
Thermal sensitivity error
Æ0.02%/
C of reading
Thermal zero drift
Æ0.02%/
C FSO
Temperature range
0–50
C
FSO, full-scale operating range.
20 Chapter 1 Basic Concepts of Measurement Methods
15:40:35 Page 20
Sequential Test
A sequential test applies a sequential variation in the input value over the desired input range. This
may be accomplished by increasing the input value (upscale direction) or by decreasing the input
value (downscale direction) over the full input range.
Hysteresis
The sequential test is an effective diagnostic technique for identifying and quantifying hysteresis
error in a measurement system. Hysteresis error refers to differences between an upscale
sequential test and a downscale sequential test. The hysteresis error of the system is estimated
by its uncertainty u h ¼ y
ð Þ upscale À y
ð Þ downscale . The effect of hysteresis in a sequential test
calibration curve is illustrated in Figure 1.13a. Hysteresis is usually specified for a measurement
system in terms of the maximum hysteresis error as a percentage of full-scale output range, r o ,
%u h max ¼
u h max
r o
 100
ð1:6Þ
such as the value indicated in Table 1.1. Hysteresis occurs when the output of a measurement
system is dependent on the previous value indicated by the system. Such dependencies can be
brought about through some realistic system limitations such as friction or viscous damping in
moving parts or residual charge in electrical components. Some hysteresis is normal for any system
and affects the repeatability of the system.
Random Test
A random test applies a random order in the values of a known input over the intended calibration
range. The random application of input tends to reduce the impact of interference. It breaks up
hysteresis effects and observation errors. It ensures that each application of input value is
independent of the previous. As such, it reduces calibration systematic error, converting it to
random error. Generally, such a random variation in input value will more closely simulate the actual
measurement situation.
Table 1.1 Manufacturer’s Specifications: Typical Pressure Transducer
Operation
Input range
0–1000 cm H 2 O
Excitation
Æ15 V DC
Output range
0–5 V
Performance
Linearity error
Æ0.5% FSO
Hysteresis error
Less than Æ0.15% FSO
Sensitivity error
Æ0.25% of reading
Thermal sensitivity error
Æ0.02%/
C of reading
Thermal zero drift
Æ0.02%/
C FSO
Temperature range
0–50
C
FSO, full-scale operating range.
20 Chapter 1 Basic Concepts of Measurement Methods